 3
3peptides
spectra
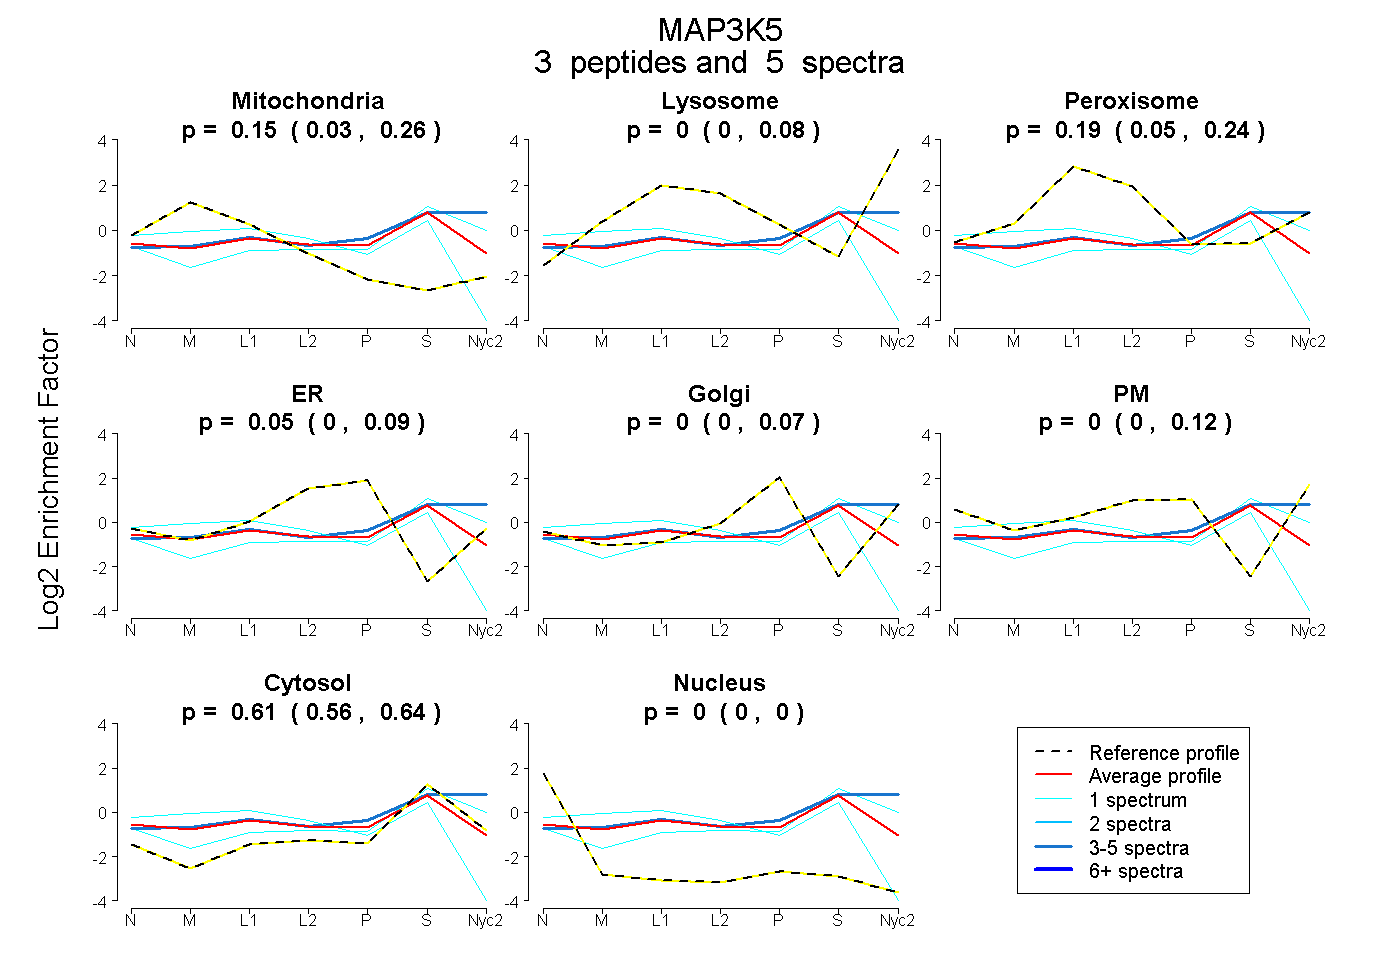
0.027 | 0.256
0.000 | 0.083
0.048 | 0.242
0.000 | 0.093
0.000 | 0.071
0.000 | 0.121
0.556 | 0.644
0.000 | 0.000
| Plot | Mito | Lyso | Perox | ER | Golgi | PM | Cytosol | Nucleus | |||||
| Expt A |
3 peptides |
5 spectra |
|
0.152 0.027 | 0.256 |
0.000 0.000 | 0.083 |
0.186 0.048 | 0.242 |
0.053 0.000 | 0.093 |
0.000 0.000 | 0.071 |
0.000 0.000 | 0.121 |
0.609 0.556 | 0.644 |
0.000 0.000 | 0.000 |
| 3 spectra, DLSNQVR | 0.019 | 0.288 | 0.000 | 0.000 | 0.000 | 0.100 | 0.593 | 0.000 | ||
| 1 spectrum, YLHDNQIVHR | 0.555 | 0.000 | 0.014 | 0.000 | 0.000 | 0.000 | 0.431 | 0.000 | ||
| 1 spectrum, ADPFSFK | 0.000 | 0.066 | 0.045 | 0.000 | 0.000 | 0.120 | 0.770 | 0.000 |
| Plot | Lyso | Other | |||||||||||
| Expt C |
3 peptides |
5 spectra |
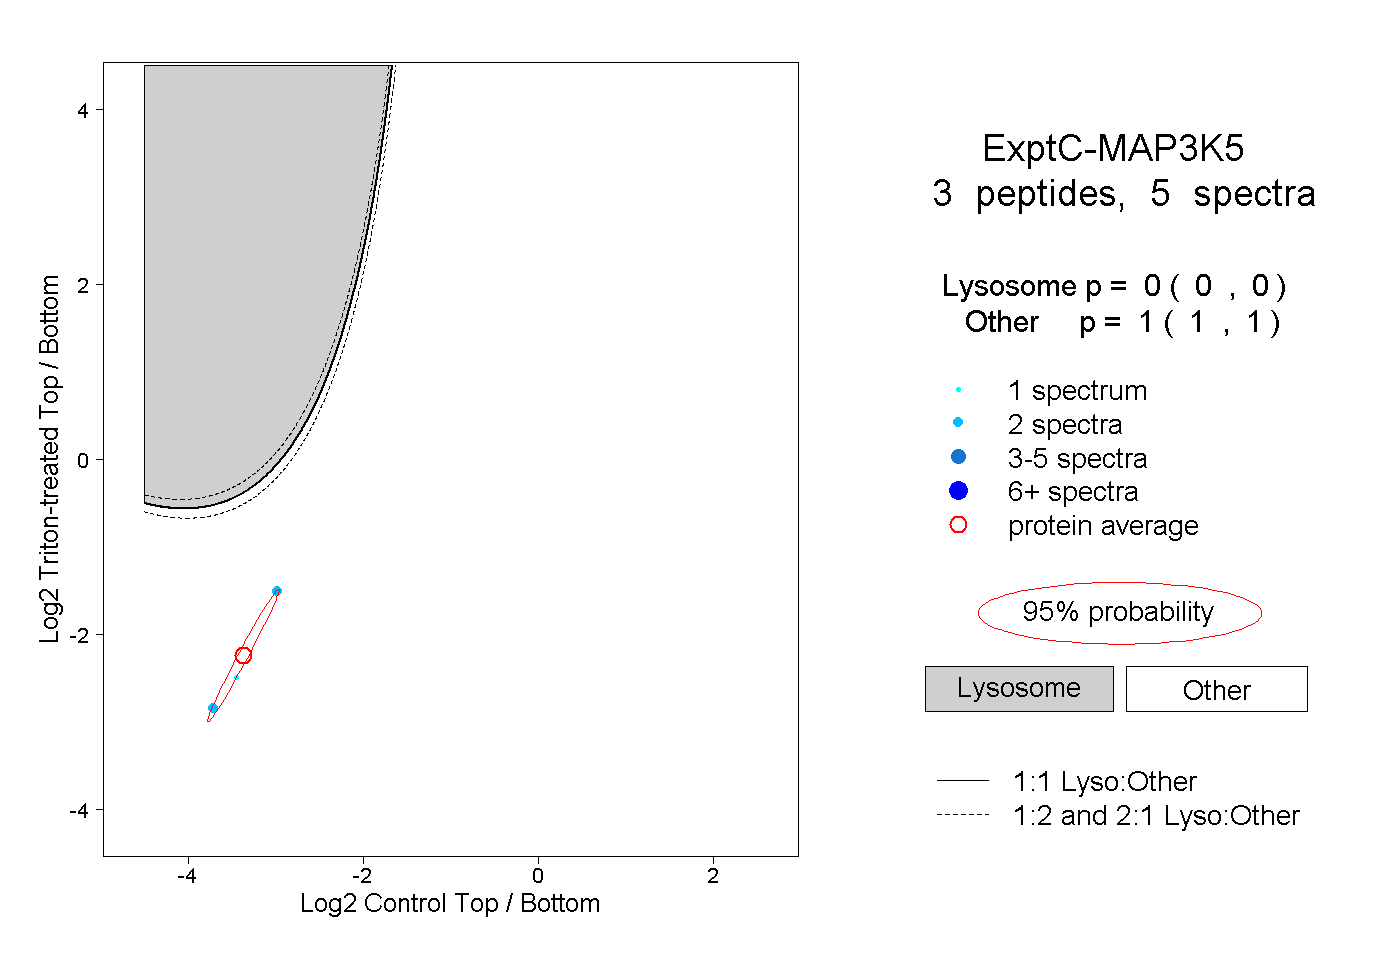 |
0.000 0.000 | 0.000 |
1.000 1.000 | 1.000 |