 10
10peptides
spectra
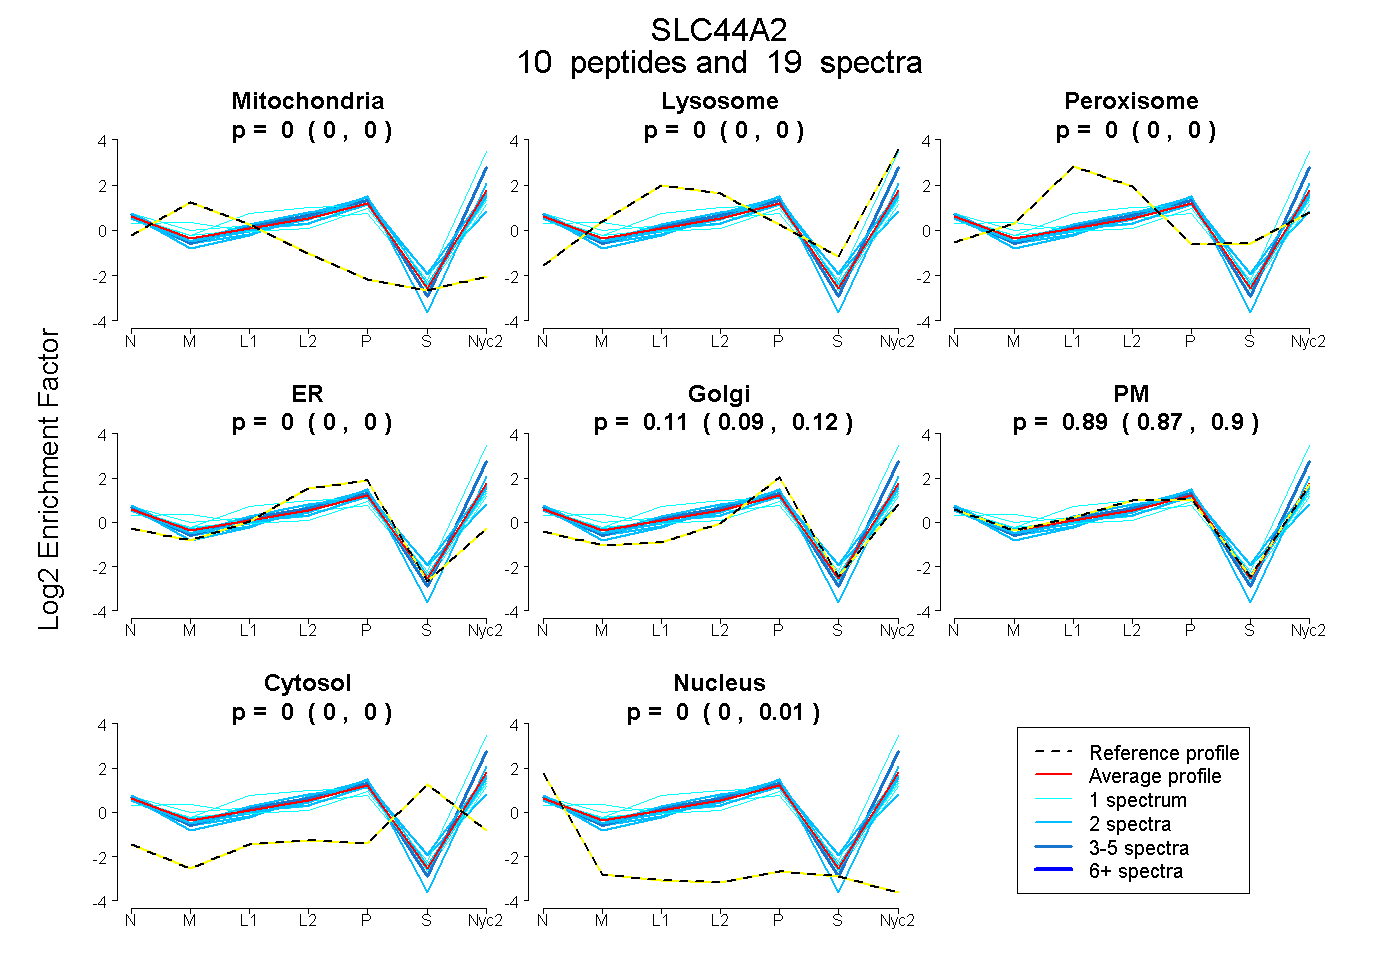
0.000 | 0.000
0.000 | 0.000
0.000 | 0.000
0.000 | 0.000
0.093 | 0.123
0.868 | 0.903
0.000 | 0.000
0.000 | 0.009
2peptides
spectra
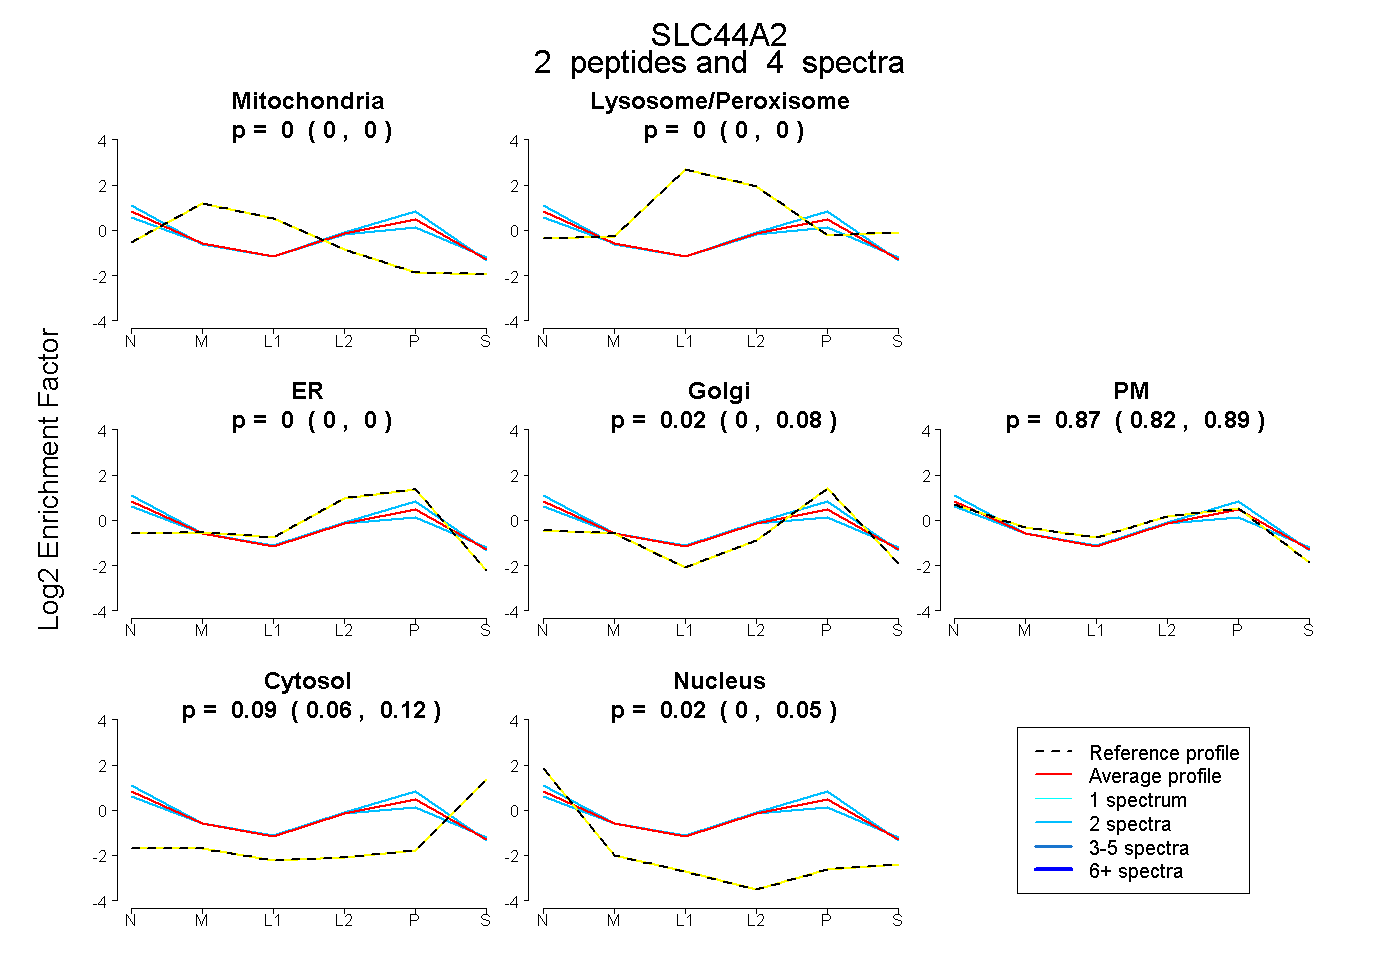
0.000 | 0.000
0.000 | 0.000
0.000 | 0.000
0.000 | 0.084
0.819 | 0.889
0.059 | 0.117
0.000 | 0.047
9peptides
spectra
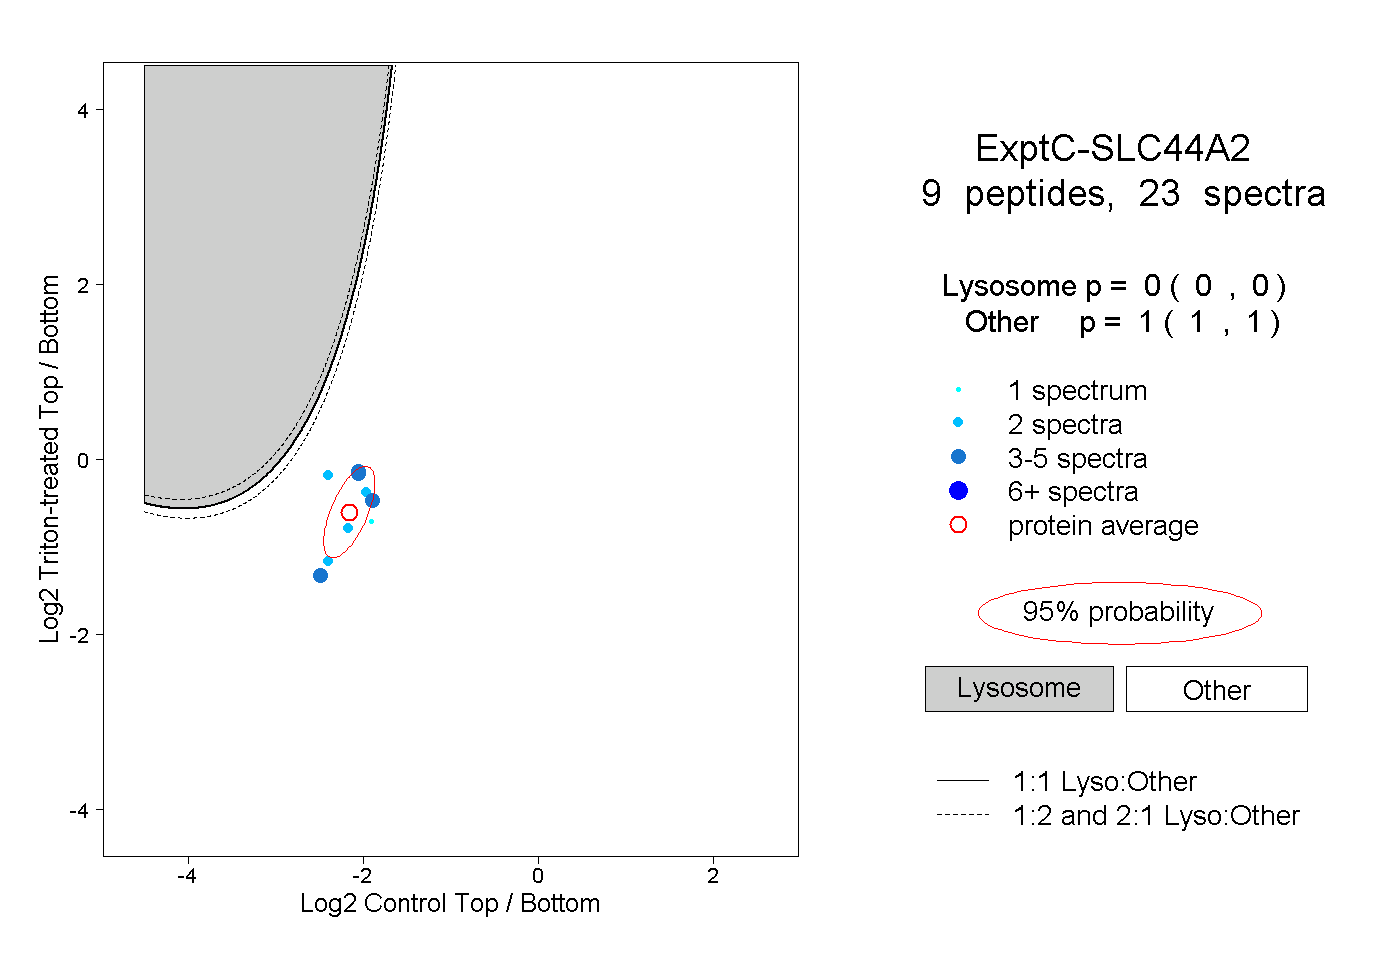
0.000 | 0.000
1.000 | 1.000