SLC44A2
[ENSRNOP00000051322]
Main page
| | | Plot |
Mito |
Lyso |
|
Perox |
ER |
Golgi |
PM |
Cytosol |
Nucleus |
|
| Expt A |
 10
10
peptides |
19
spectra |
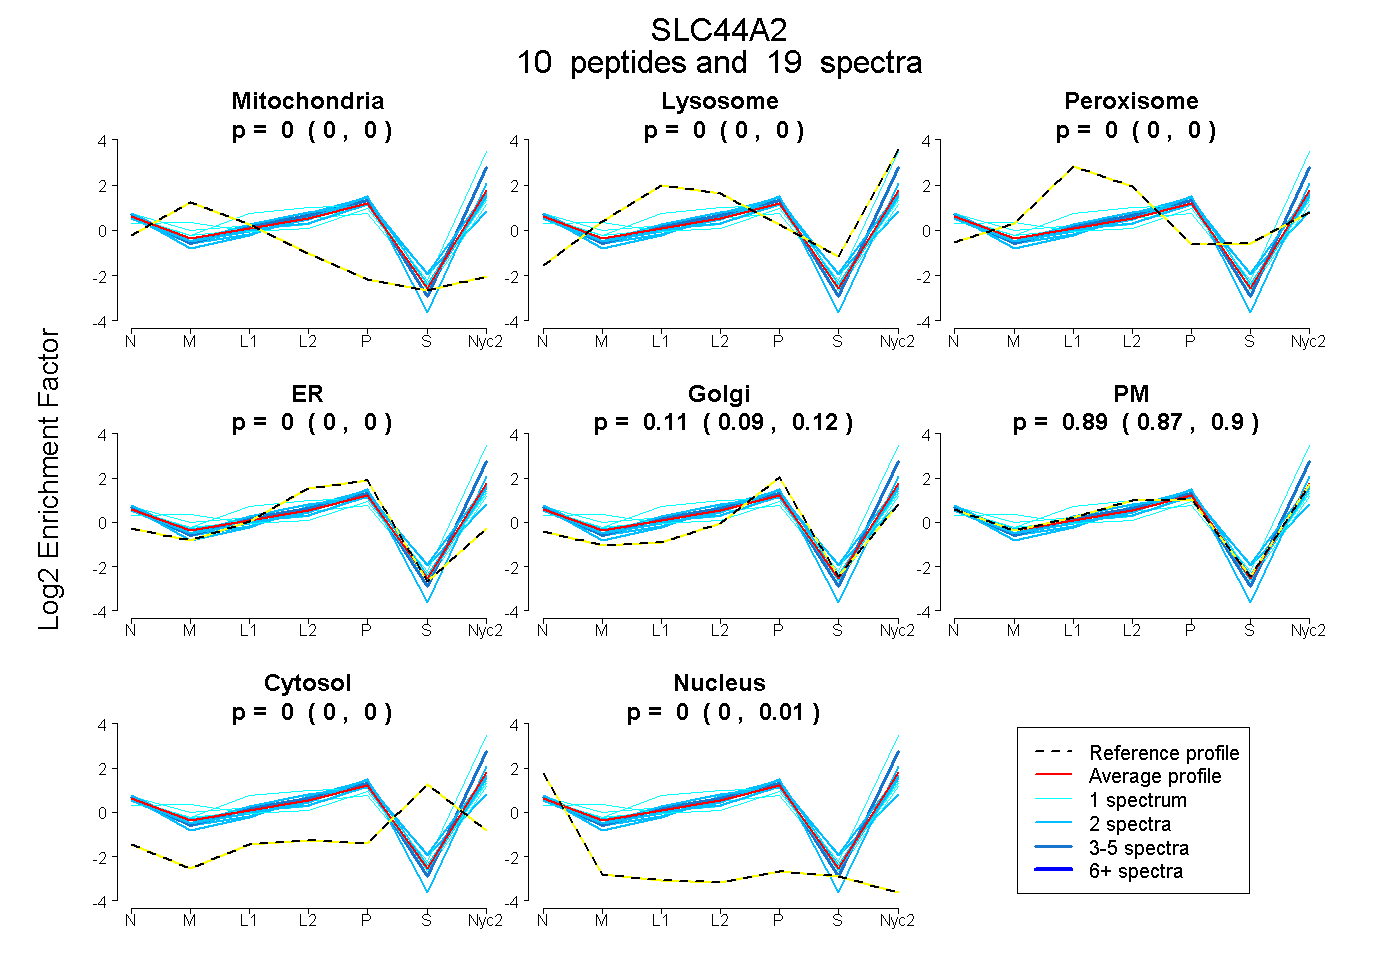 |
0.000
0.000 | 0.000 |
0.000
0.000 | 0.000 |
|
0.000
0.000 | 0.000 |
0.000
0.000 | 0.000 |
0.110
0.093 | 0.123 |
0.887
0.868 | 0.903 |
0.000
0.000 | 0.000 |
0.003
0.000 | 0.009 |
|
| | | Plot |
Mito |
|
Lyso or Perox |
|
ER |
Golgi |
PM |
Cytosol |
Nucleus |
|
| Expt B |
2
peptides |
4
spectra |
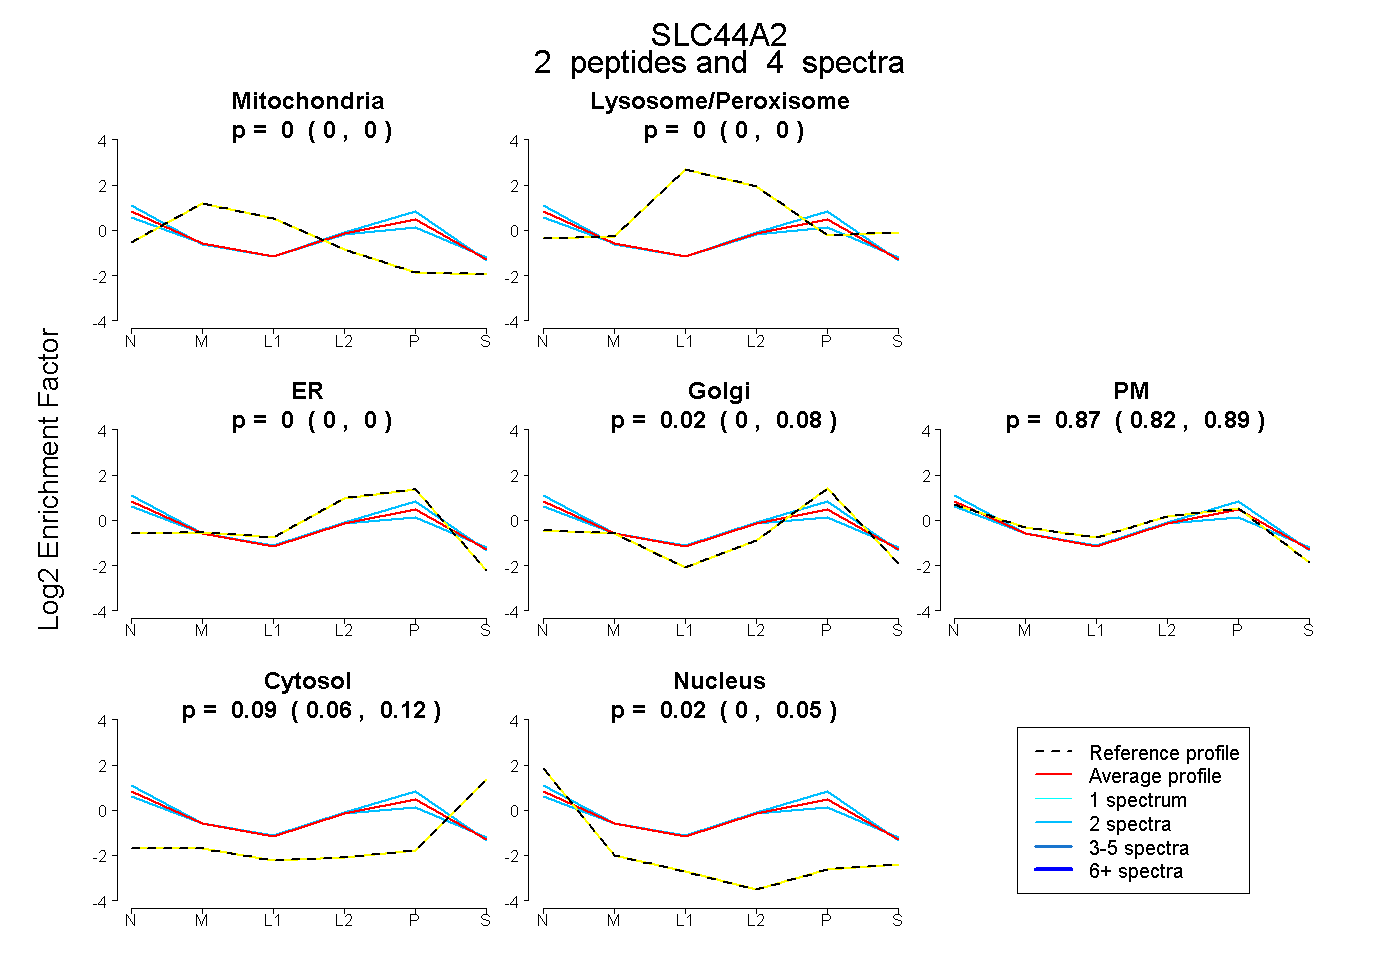 |
0.000
0.000 | 0.000 |
|
0.000
0.000 | 0.000 |
|
0.000
0.000 | 0.000 |
0.015
0.000 | 0.084 |
0.871
0.819 | 0.889 |
0.093
0.059 | 0.117 |
0.021
0.000 | 0.047 |
|
| 2 spectra, YLTFLSAR |
0.000 |
|
0.009 |
|
0.000 |
0.000 |
0.830 |
0.083 |
0.079 |
|
| 2 spectra, GVAEVLR |
0.000 |
|
0.008 |
|
0.000 |
0.182 |
0.752 |
0.057 |
0.000 |
|
| | | Plot |
|
Lyso |
|
|
|
|
|
|
|
Other |
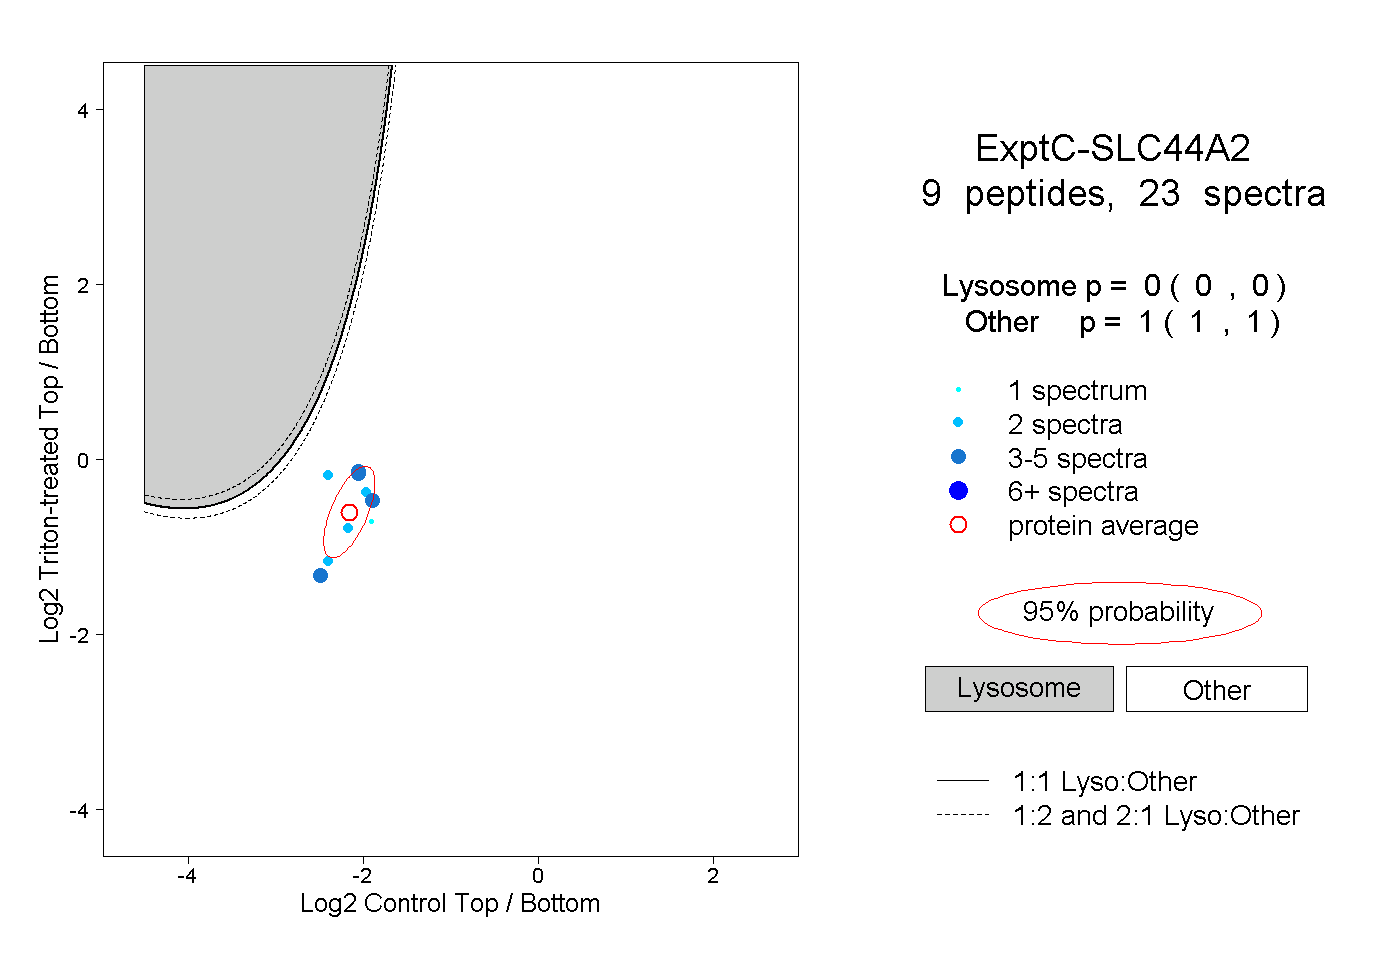
| Expt C |
9
peptides |
23
spectra |
 |
|
0.000
0.000 | 0.000 |
|
|
|
|
|
|
|
1.000
1.000 | 1.000 |