 10
10peptides
spectra
0.000 | 0.000
0.000 | 0.000
0.000 | 0.000
0.000 | 0.000
0.093 | 0.123
0.868 | 0.903
0.000 | 0.000
0.000 | 0.009
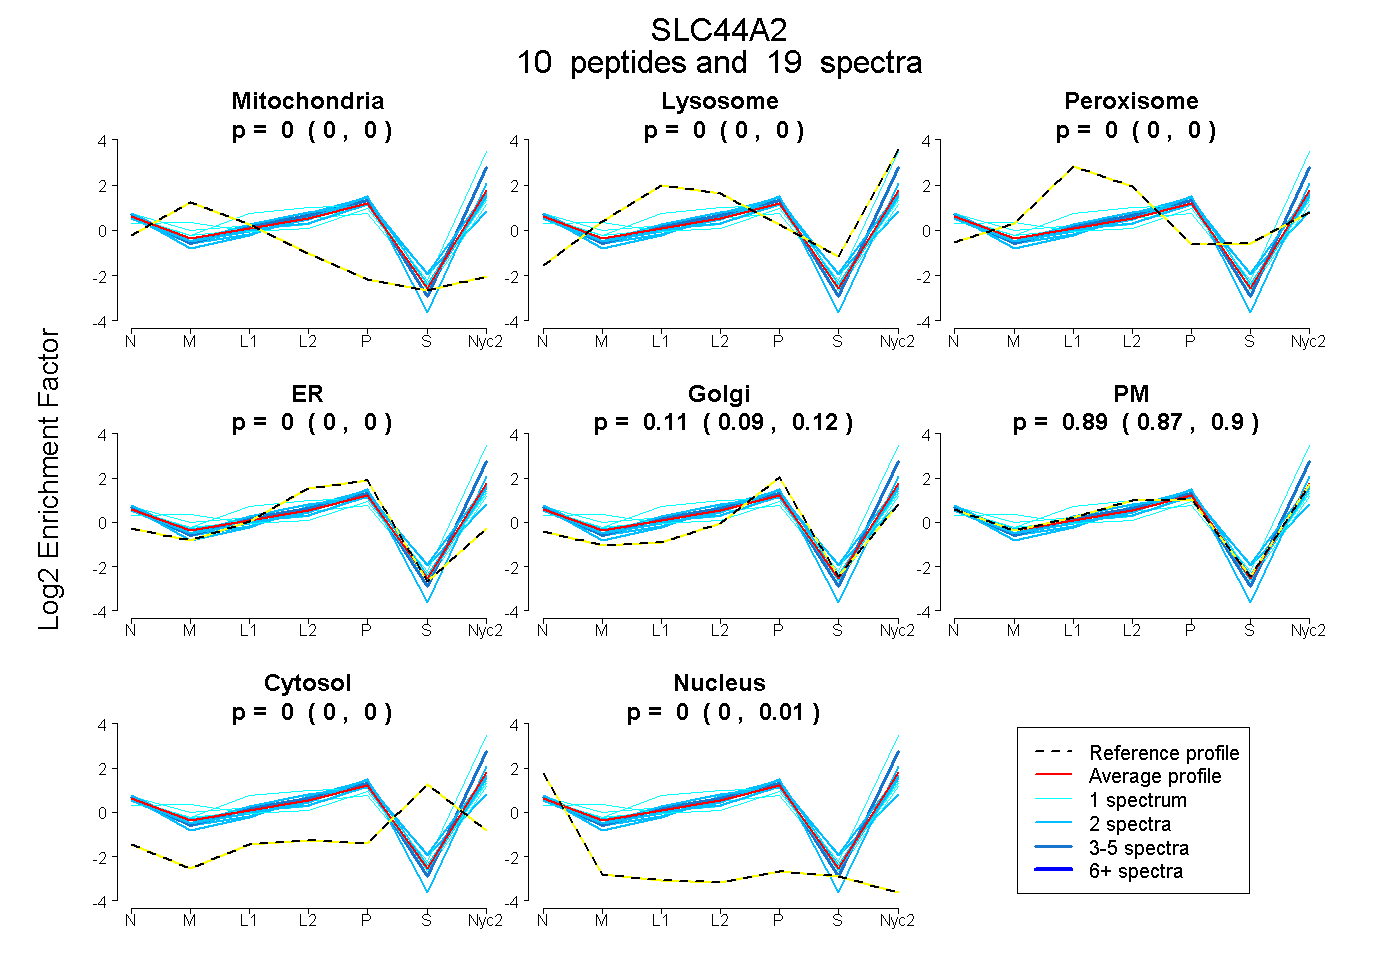
| Plot | Mito | Lyso | Perox | ER | Golgi | PM | Cytosol | Nucleus | |||||
| Expt A |
10 peptides |
19 spectra |
|
0.000 0.000 | 0.000 |
0.000 0.000 | 0.000 |
0.000 0.000 | 0.000 |
0.000 0.000 | 0.000 |
0.110 0.093 | 0.123 |
0.887 0.868 | 0.903 |
0.000 0.000 | 0.000 |
0.003 0.000 | 0.009 |
| 2 spectra, YLTFLSAR | 0.000 | 0.021 | 0.000 | 0.000 | 0.113 | 0.800 | 0.066 | 0.000 | ||
| 2 spectra, GVAEVLR | 0.000 | 0.000 | 0.000 | 0.000 | 0.249 | 0.747 | 0.000 | 0.004 | ||
| 2 spectra, CFPAIHASK | 0.000 | 0.000 | 0.000 | 0.152 | 0.148 | 0.607 | 0.067 | 0.026 | ||
| 1 spectrum, YDPTFK | 0.148 | 0.045 | 0.000 | 0.000 | 0.204 | 0.603 | 0.000 | 0.000 | ||
| 5 spectra, KPDDMPAFPLFSAFGR | 0.000 | 0.034 | 0.000 | 0.000 | 0.000 | 0.966 | 0.000 | 0.000 | ||
| 2 spectra, QFCVPGFK | 0.000 | 0.000 | 0.000 | 0.019 | 0.002 | 0.958 | 0.000 | 0.021 | ||
| 1 spectrum, DGECPAVIIPSKPLAQR | 0.076 | 0.000 | 0.000 | 0.000 | 0.274 | 0.650 | 0.000 | 0.000 | ||
| 1 spectrum, GEFCGQK | 0.109 | 0.000 | 0.000 | 0.000 | 0.000 | 0.889 | 0.000 | 0.003 | ||
| 2 spectra, VIYPTDSR | 0.000 | 0.000 | 0.000 | 0.000 | 0.175 | 0.825 | 0.000 | 0.000 | ||
| 1 spectrum, NAFFLLMR | 0.000 | 0.320 | 0.000 | 0.000 | 0.000 | 0.680 | 0.000 | 0.000 |
| Plot | Mito | Lyso or Perox | ER | Golgi | PM | Cytosol | Nucleus | ||||||
| Expt B |
2 peptides |
4 spectra |
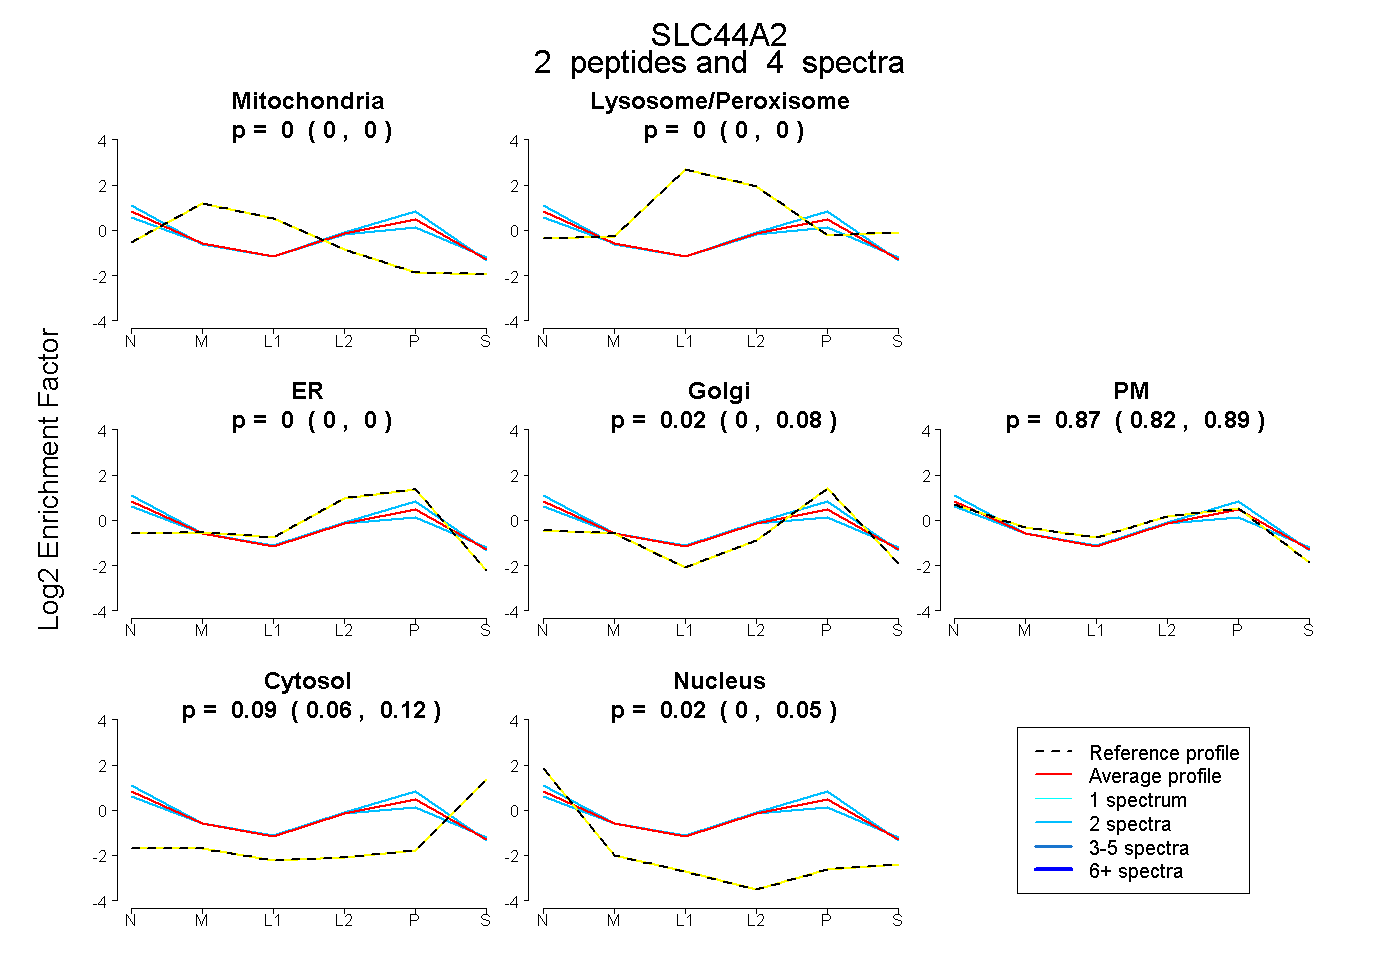 |
0.000 0.000 | 0.000 |
0.000 0.000 | 0.000 |
0.000 0.000 | 0.000 |
0.015 0.000 | 0.084 |
0.871 0.819 | 0.889 |
0.093 0.059 | 0.117 |
0.021 0.000 | 0.047 |
|||
| Plot | Lyso | Other | |||||||||||
| Expt C |
9 peptides |
23 spectra |
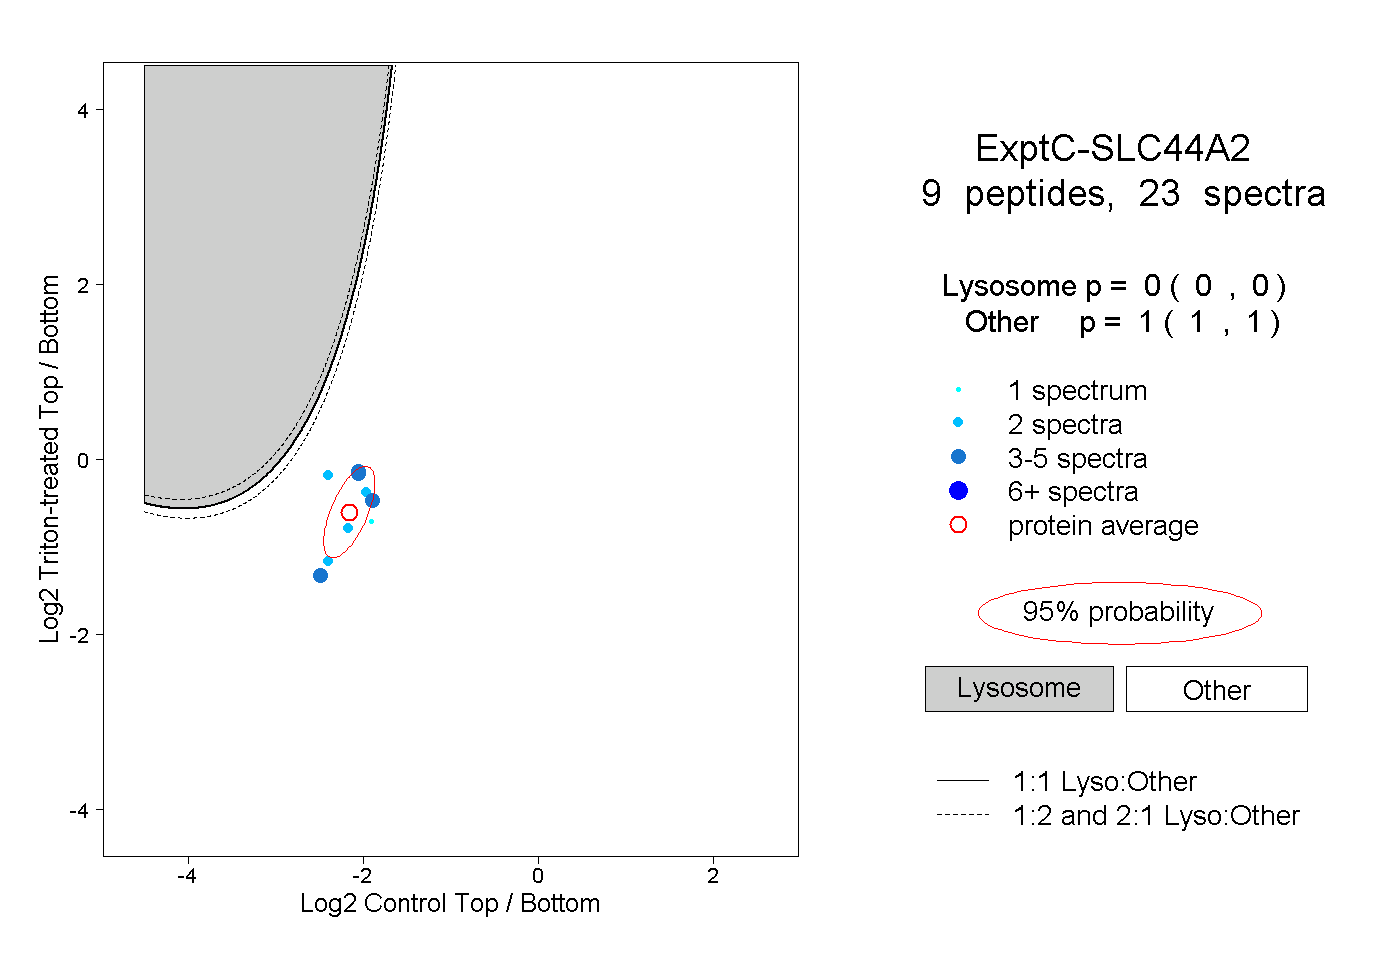 |
0.000 0.000 | 0.000 |
1.000 1.000 | 1.000 |