15
15peptides
spectra
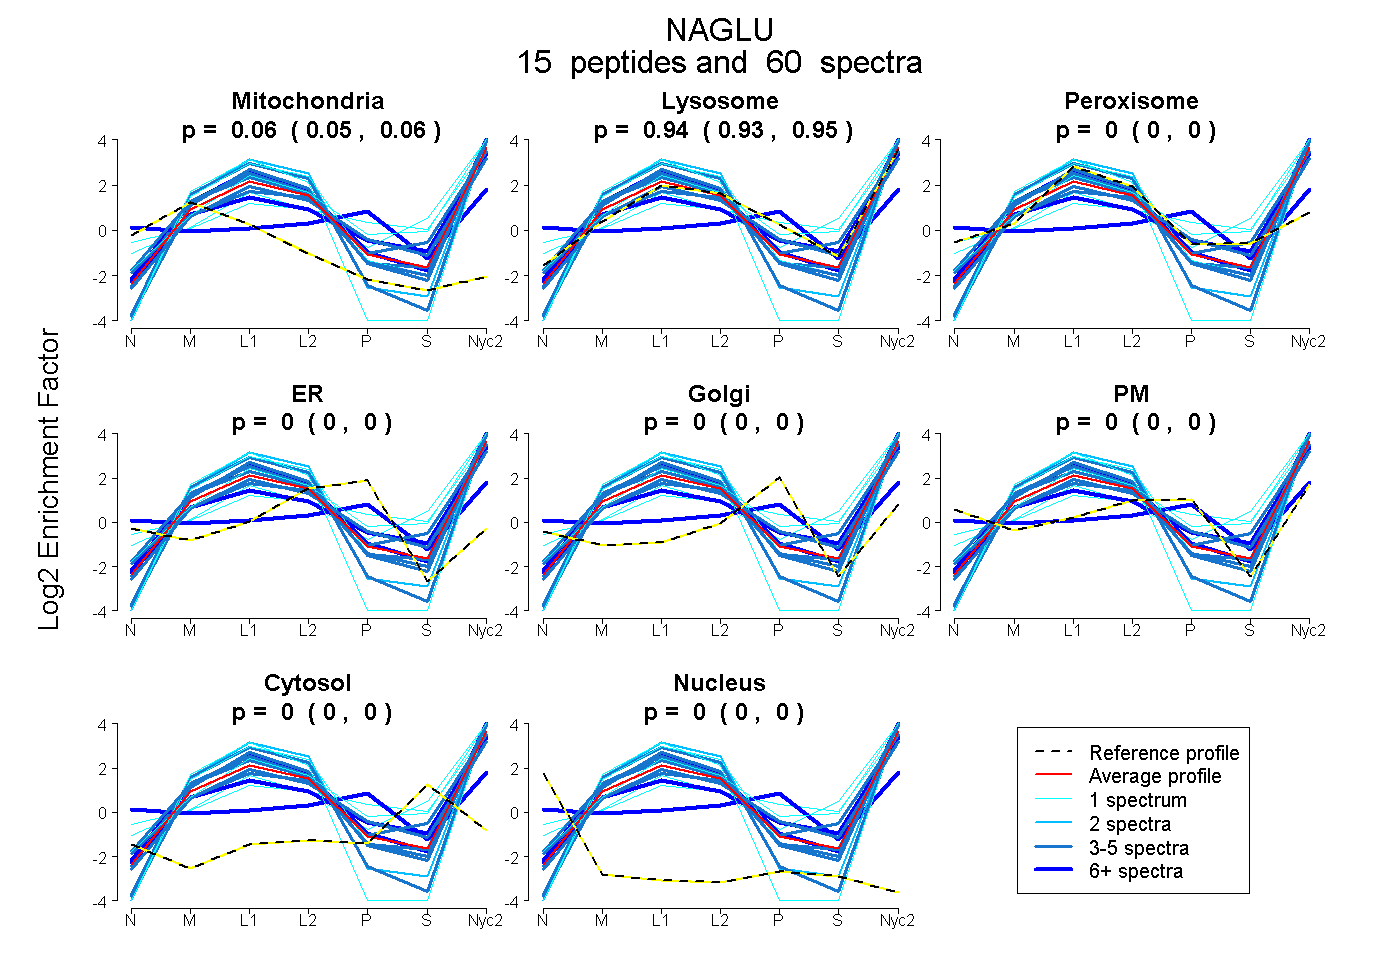
0.051 | 0.064
0.934 | 0.948
0.000 | 0.000
0.000 | 0.000
0.000 | 0.000
0.000 | 0.000
0.000 | 0.000
0.000 | 0.000
8peptides
spectra
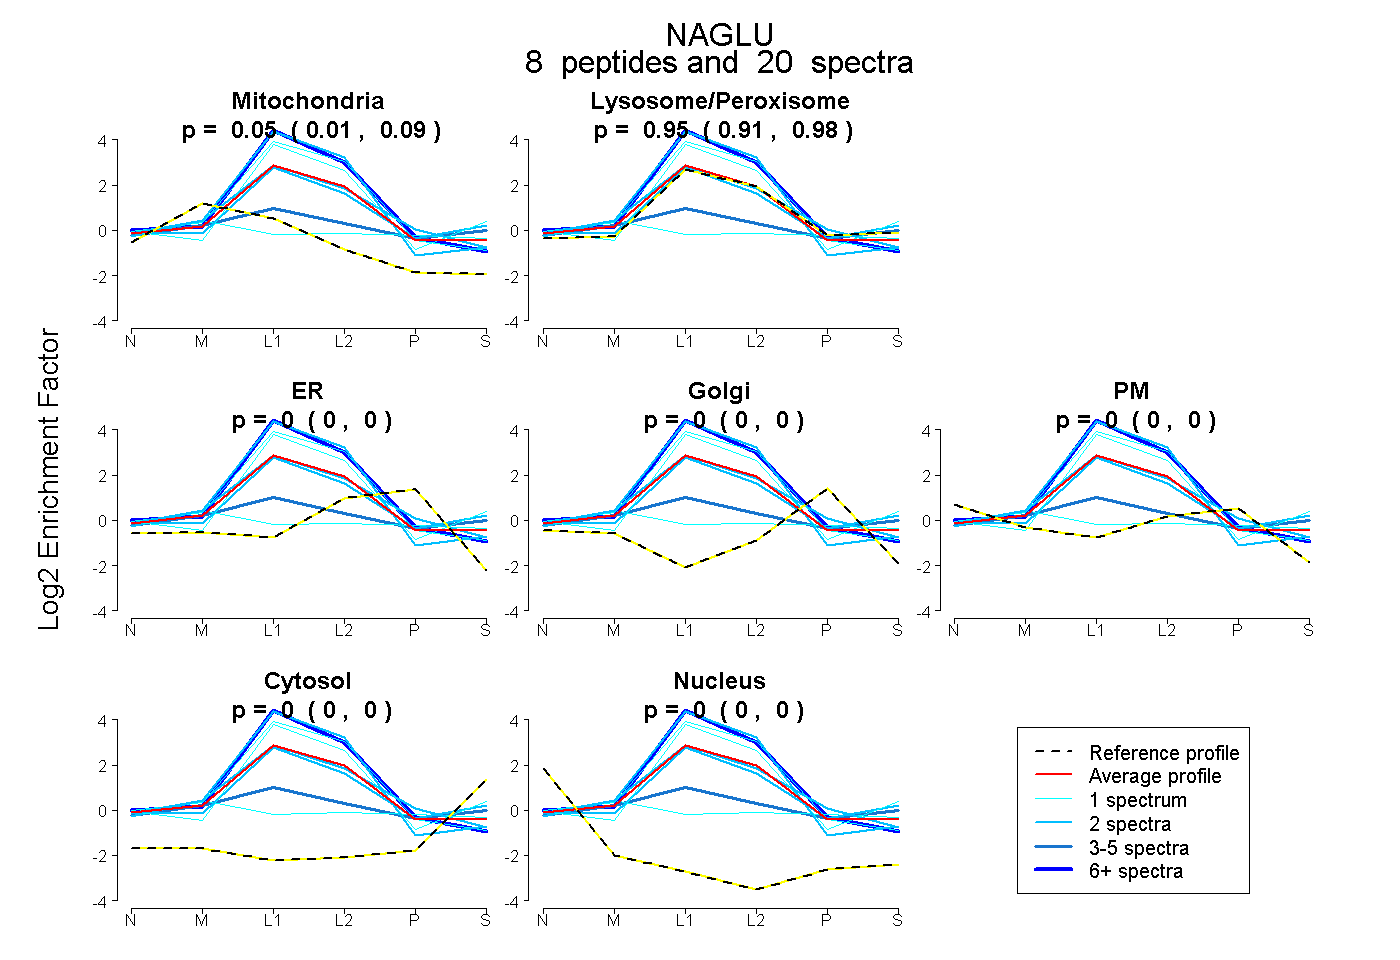
0.013 | 0.085
0.909 | 0.978
0.000 | 0.000
0.000 | 0.000
0.000 | 0.000
0.000 | 0.000
0.000 | 0.000
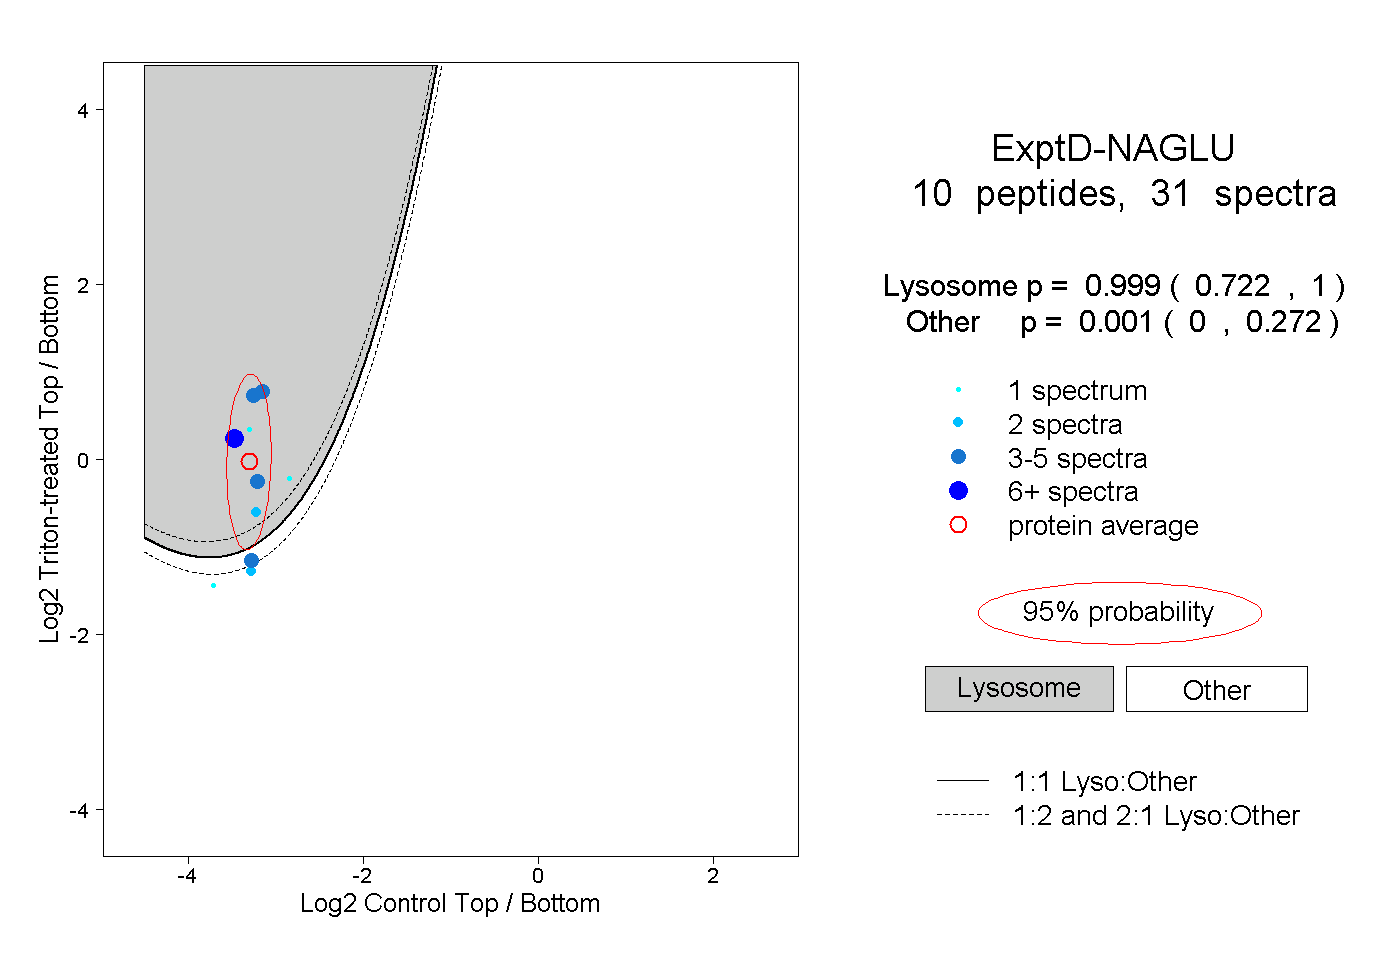
18peptides
spectra
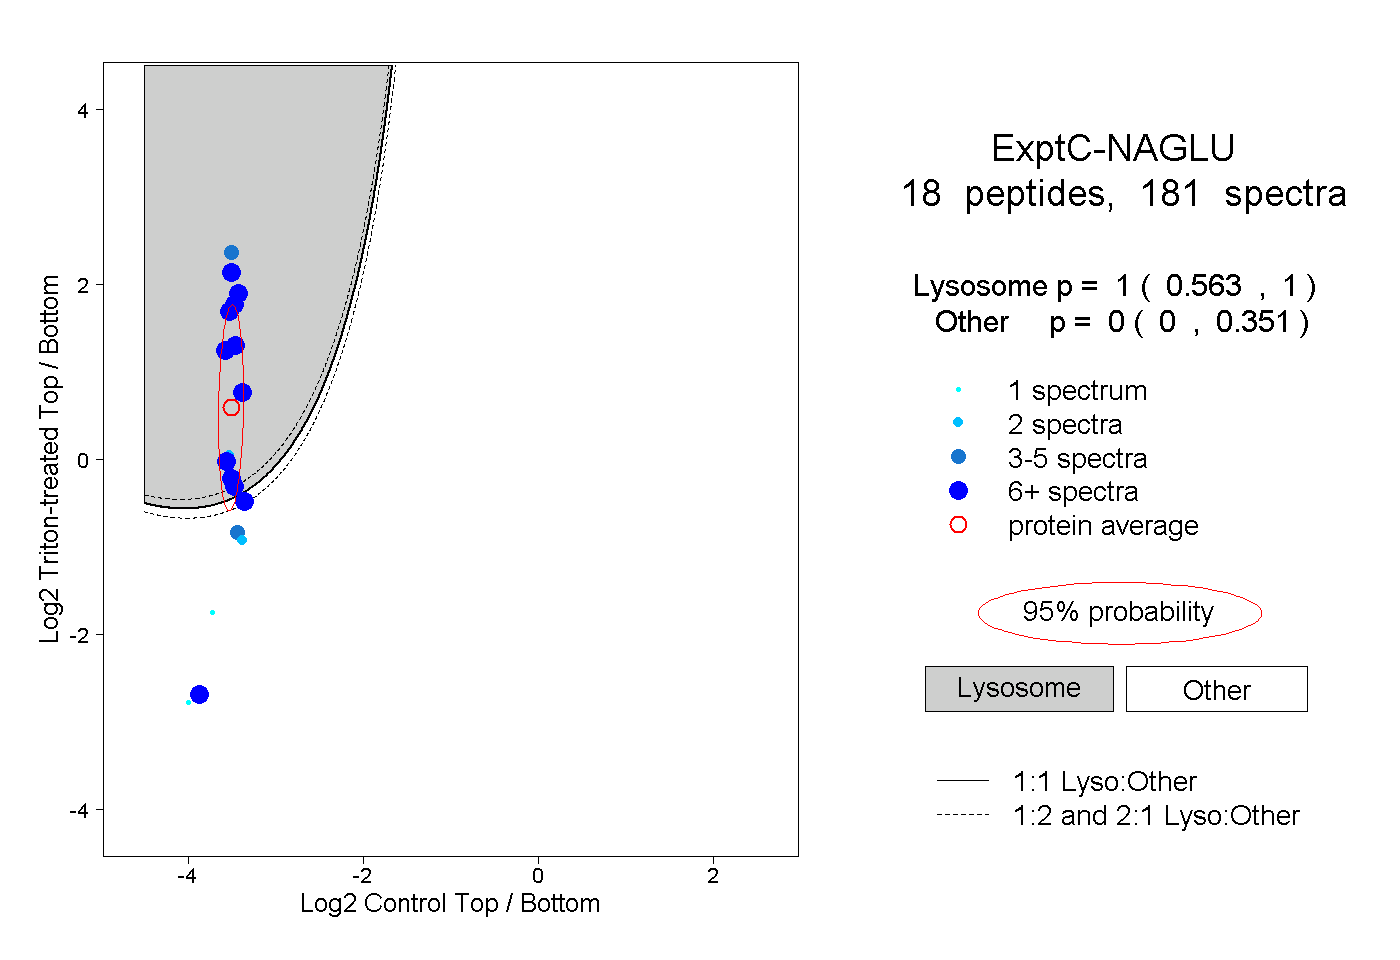
0.563 | 1.000
0.000 | 0.351