 5
5peptides
spectra
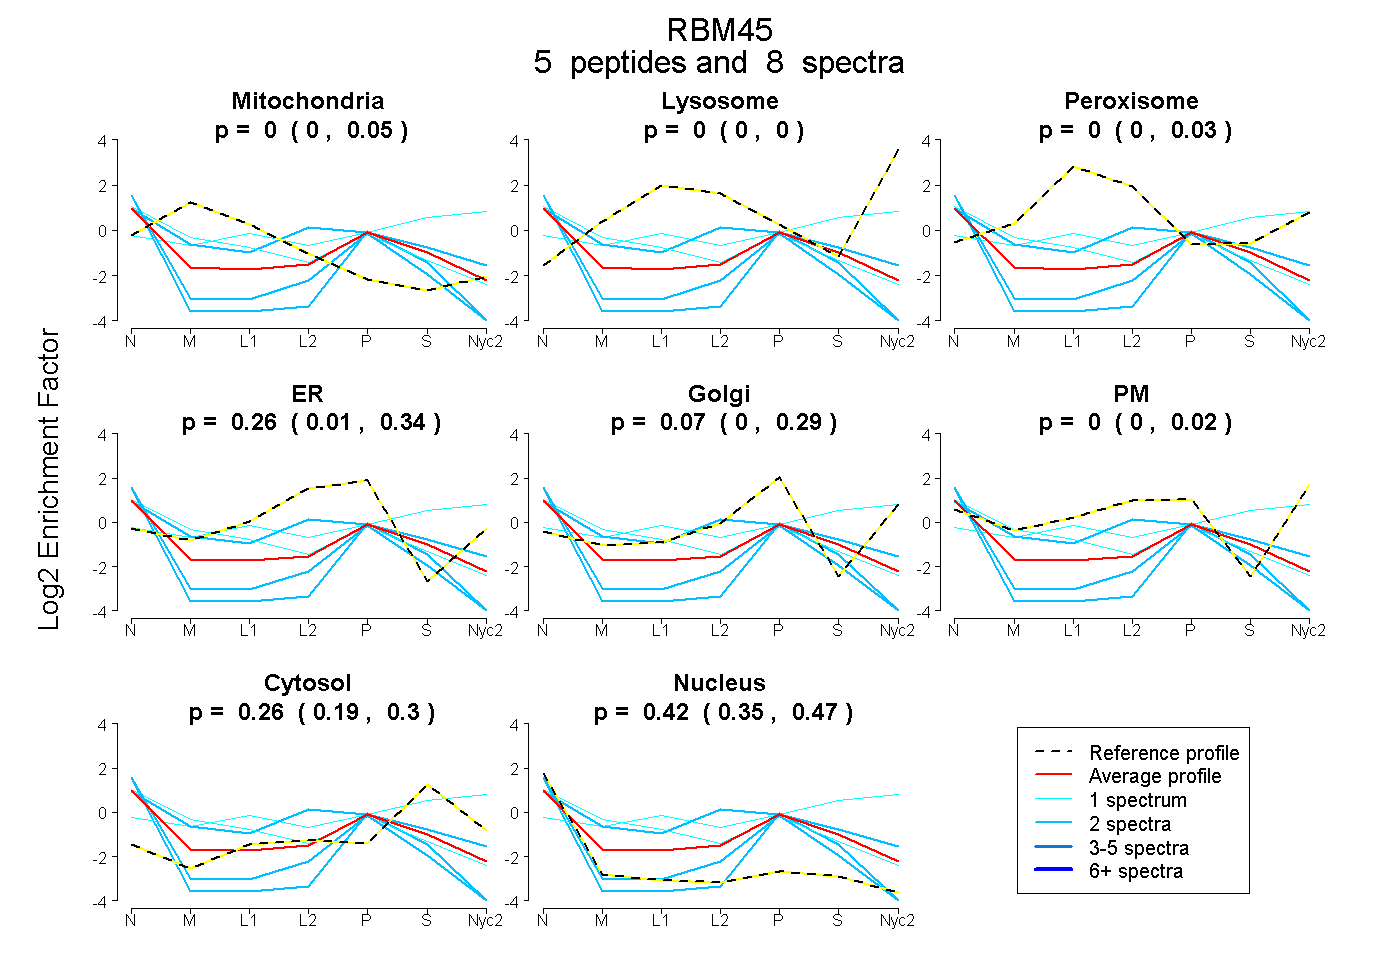
0.000 | 0.053
0.000 | 0.000
0.000 | 0.030
0.006 | 0.339
0.000 | 0.294
0.000 | 0.024
0.186 | 0.301
0.348 | 0.471
| Plot | Mito | Lyso | Perox | ER | Golgi | PM | Cytosol | Nucleus | |||||
| Expt A |
5 peptides |
8 spectra |
|
0.000 0.000 | 0.053 |
0.000 0.000 | 0.000 |
0.000 0.000 | 0.030 |
0.259 0.006 | 0.339 |
0.067 0.000 | 0.294 |
0.000 0.000 | 0.024 |
0.256 0.186 | 0.301 |
0.418 0.348 | 0.471 |
| 2 spectra, VFIAQSR | 0.000 | 0.000 | 0.000 | 0.194 | 0.000 | 0.000 | 0.029 | 0.777 | ||
| 1 spectrum, SYTEEDLR | 0.317 | 0.000 | 0.000 | 0.261 | 0.019 | 0.000 | 0.123 | 0.281 | ||
| 2 spectra, IFLVISK | 0.000 | 0.000 | 0.000 | 0.000 | 0.064 | 0.000 | 0.121 | 0.815 | ||
| 1 spectrum, IFVMIPK | 0.000 | 0.154 | 0.061 | 0.000 | 0.000 | 0.263 | 0.522 | 0.000 | ||
| 2 spectra, QETLGHEPR | 0.035 | 0.000 | 0.177 | 0.354 | 0.000 | 0.000 | 0.173 | 0.260 |
| Plot | Mito | Lyso or Perox | ER | Golgi | PM | Cytosol | Nucleus | ||||||
| Expt B |
1 peptide |
2 spectra |
 |
0.000 NA | NA |
0.000 NA | NA |
0.000 NA | NA |
0.060 NA | NA |
0.000 NA | NA |
0.000 NA | NA |
0.940 NA | NA |