 19
19peptides
spectra
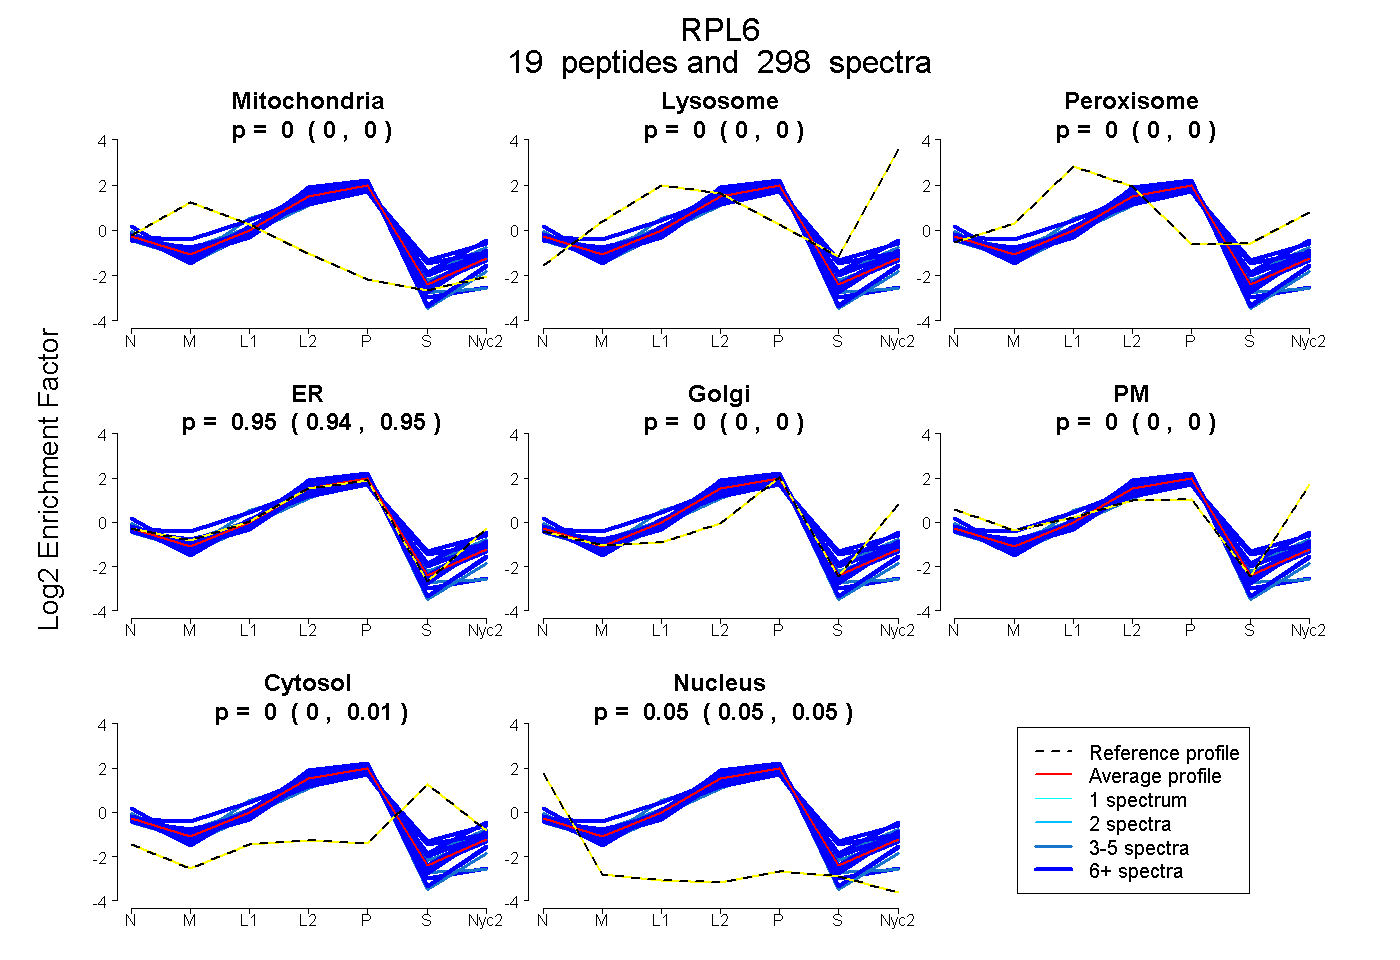
0.000 | 0.000
0.000 | 0.000
0.000 | 0.000
0.944 | 0.947
0.000 | 0.000
0.000 | 0.000
0.000 | 0.005
0.049 | 0.053
14peptides
spectra
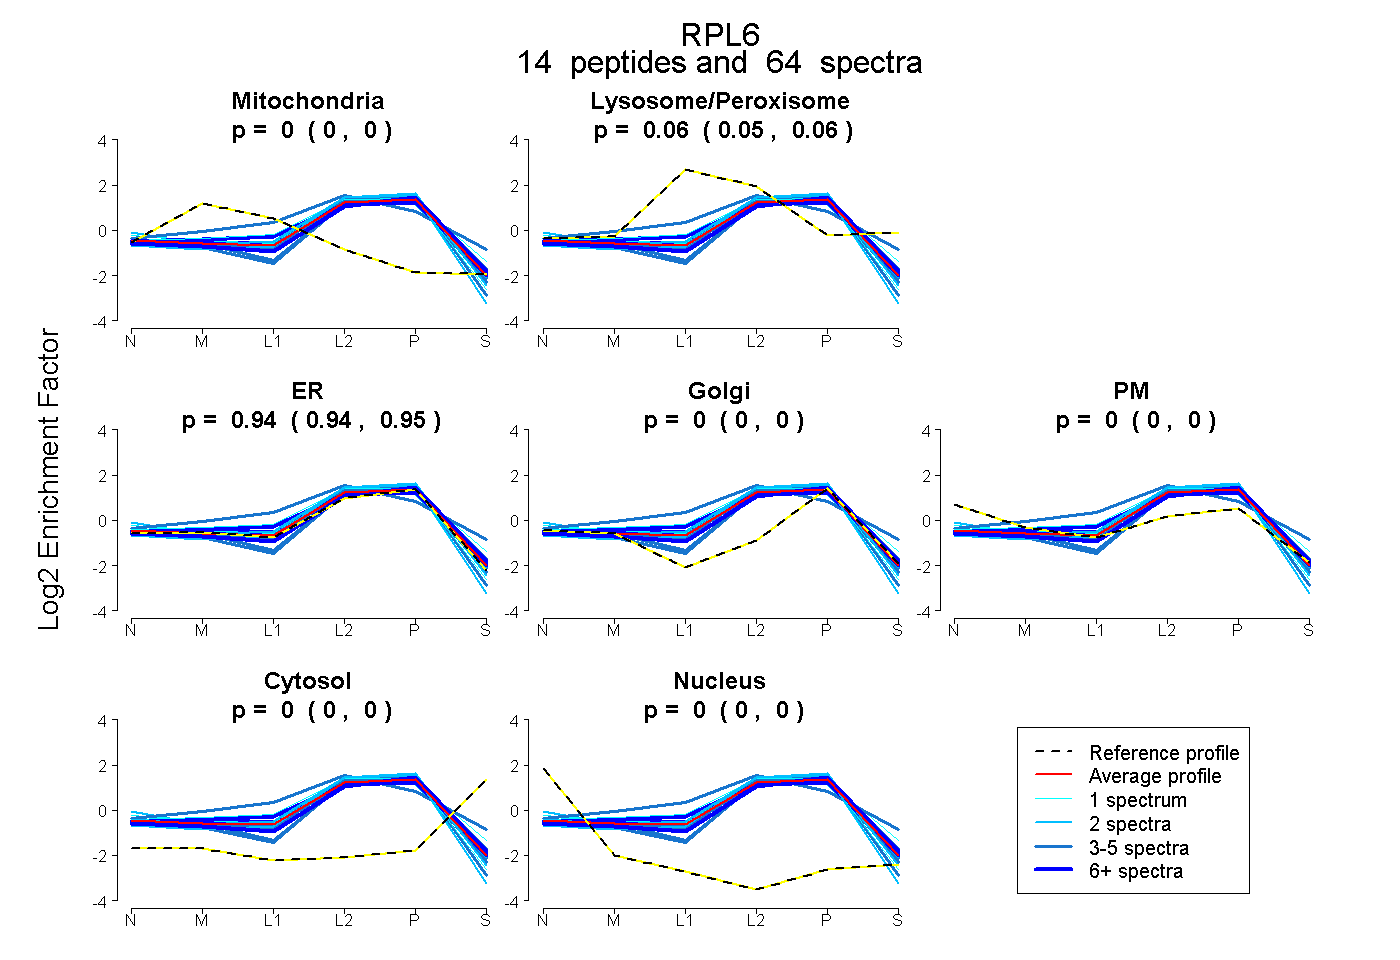
0.000 | 0.000
0.049 | 0.061
0.937 | 0.950
0.000 | 0.000
0.000 | 0.000
0.000 | 0.000
0.000 | 0.000
18peptides
spectra
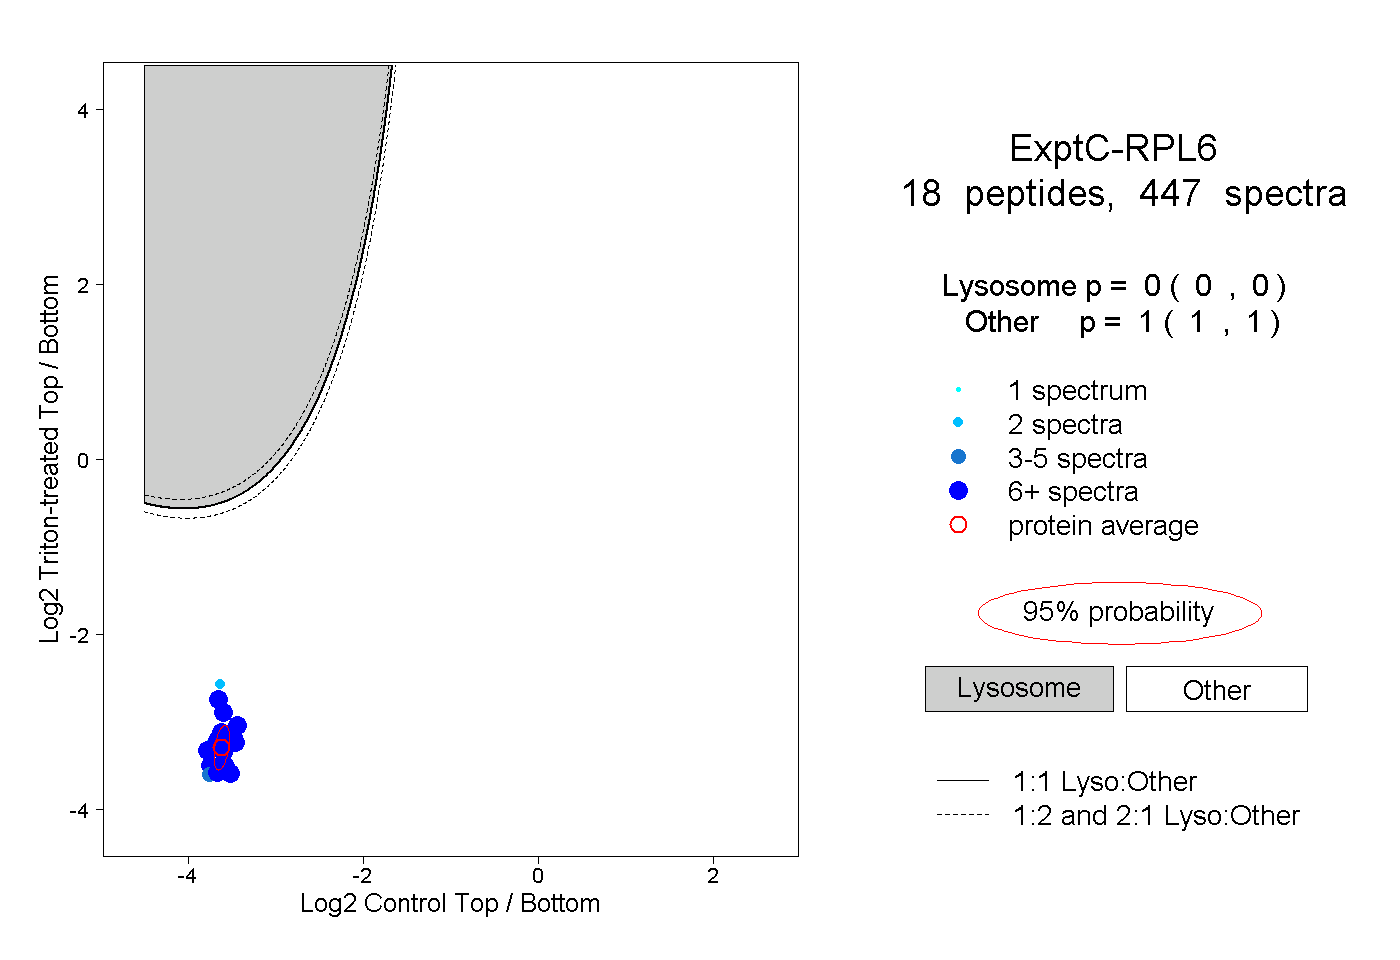
0.000 | 0.000
1.000 | 1.000
11peptides
spectra
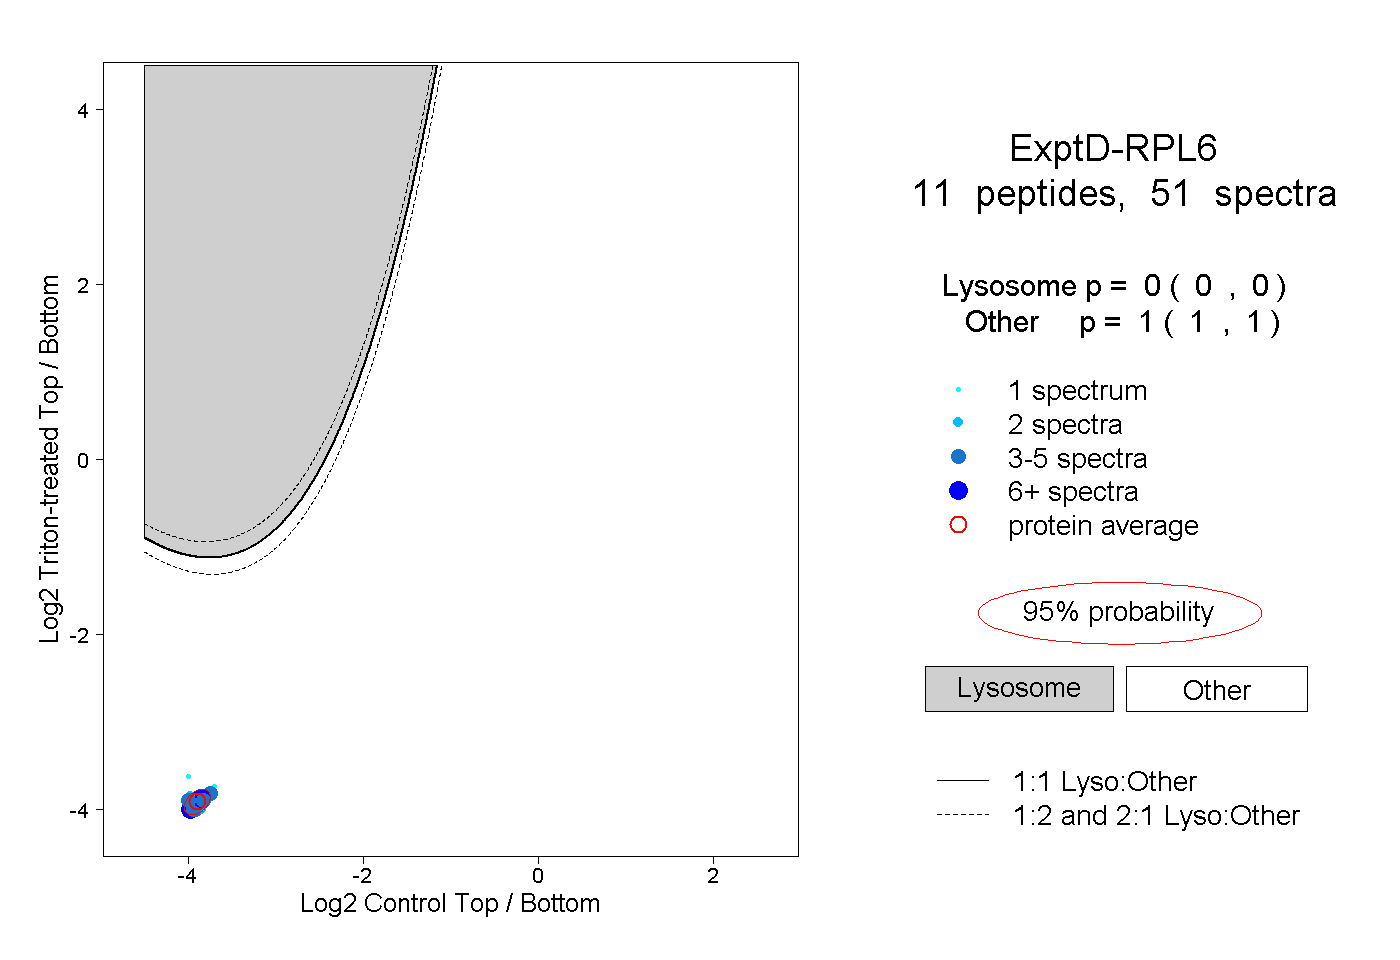
0.000 | 0.000
1.000 | 1.000