 27
27peptides
spectra
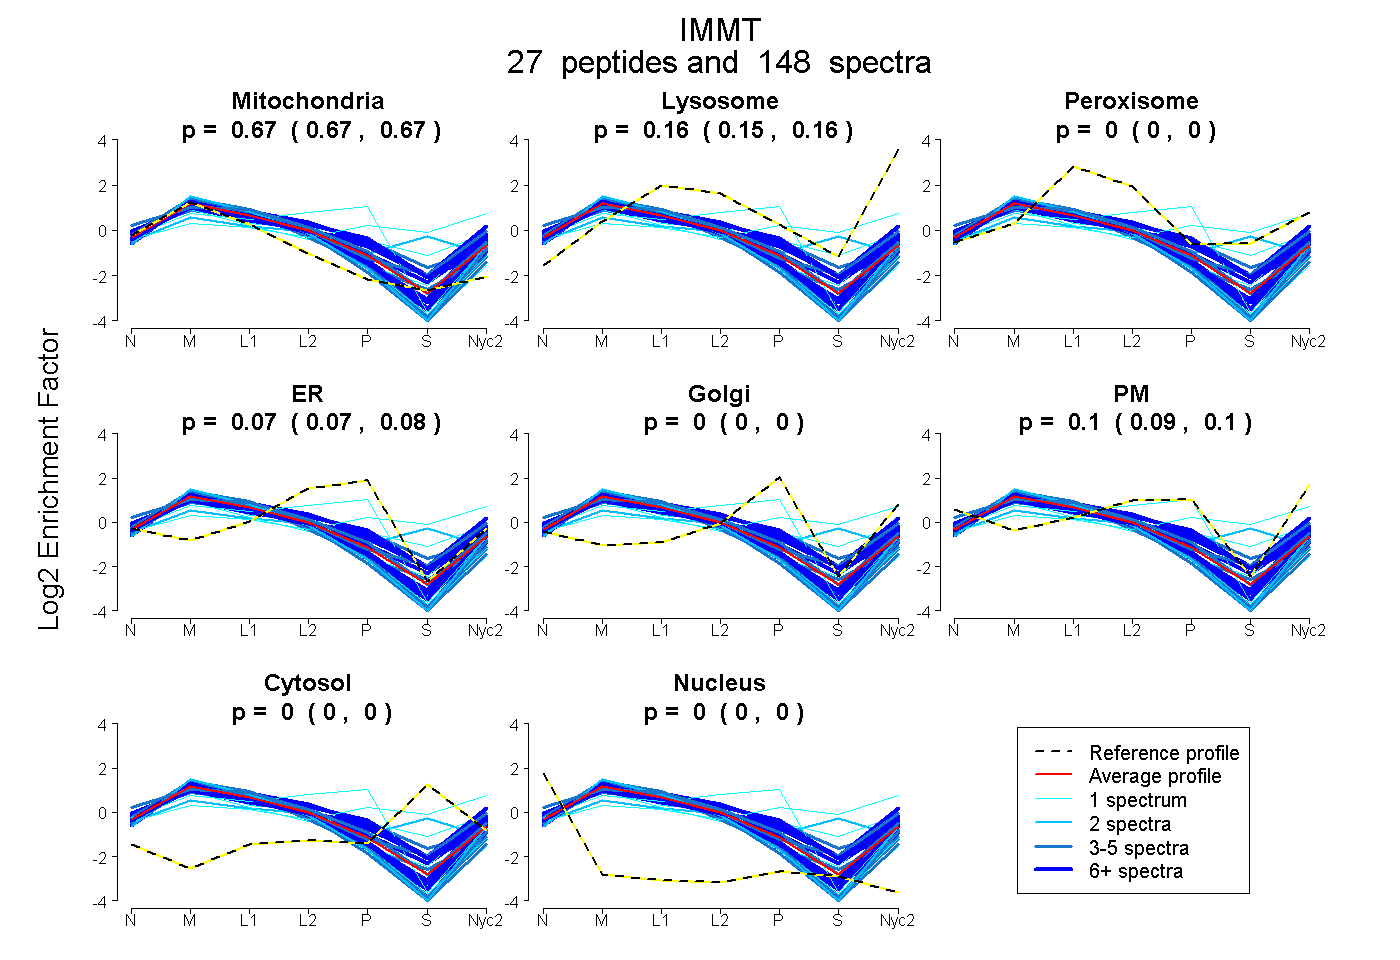
0.668 | 0.673
0.153 | 0.159
0.000 | 0.000
0.067 | 0.077
0.000 | 0.000
0.094 | 0.105
0.000 | 0.000
0.000 | 0.000
18peptides
spectra

0.818 | 0.833
0.041 | 0.056
0.104 | 0.129
0.000 | 0.000
0.000 | 0.016
0.000 | 0.000
0.000 | 0.000
34peptides
spectra

0.000 | 0.000
1.000 | 1.000
22peptides
spectra

0.002 | 0.033
0.966 | 0.998