 11
11peptides
spectra

0.000 | 0.000
0.000 | 0.000
0.000 | 0.000
0.000 | 0.000
0.000 | 0.000
0.000 | 0.000
0.960 | 0.973
0.026 | 0.039
| Plot | Mito | Lyso | Perox | ER | Golgi | PM | Cytosol | Nucleus | |||||
| Expt A |
11 peptides |
30 spectra |
|
0.000 0.000 | 0.000 |
0.000 0.000 | 0.000 |
0.000 0.000 | 0.000 |
0.000 0.000 | 0.000 |
0.000 0.000 | 0.000 |
0.000 0.000 | 0.000 |
0.967 0.960 | 0.973 |
0.033 0.026 | 0.039 |
| 2 spectra, SIDEDDDYFNLTK | 0.000 | 0.000 | 0.000 | 0.000 | 0.000 | 0.158 | 0.842 | 0.000 | ||
| 4 spectra, TLDAFSSEK | 0.207 | 0.000 | 0.000 | 0.000 | 0.000 | 0.000 | 0.736 | 0.057 | ||
| 2 spectra, AWSTGNCDNGGDEWGQEIR | 0.000 | 0.000 | 0.003 | 0.000 | 0.000 | 0.000 | 0.927 | 0.070 | ||
| 2 spectra, YYSLDELSK | 0.000 | 0.005 | 0.000 | 0.000 | 0.000 | 0.000 | 0.995 | 0.000 | ||
| 2 spectra, VVVVTAEK | 0.000 | 0.000 | 0.000 | 0.000 | 0.000 | 0.000 | 0.894 | 0.106 | ||
| 1 spectrum, LNPKPK | 0.000 | 0.000 | 0.000 | 0.000 | 0.000 | 0.000 | 0.989 | 0.011 | ||
| 3 spectra, LTEQAVEAINK | 0.000 | 0.000 | 0.000 | 0.000 | 0.000 | 0.000 | 1.000 | 0.000 | ||
| 1 spectrum, DTHGLR | 0.000 | 0.000 | 0.000 | 0.000 | 0.000 | 0.000 | 1.000 | 0.000 | ||
| 4 spectra, SAAGAADVFHR | 0.055 | 0.000 | 0.000 | 0.000 | 0.004 | 0.000 | 0.887 | 0.054 | ||
| 2 spectra, GLDDDLR | 0.000 | 0.000 | 0.000 | 0.000 | 0.000 | 0.000 | 1.000 | 0.000 | ||
| 7 spectra, FFVLCGDLVHAMPGTR | 0.000 | 0.000 | 0.000 | 0.000 | 0.000 | 0.000 | 1.000 | 0.000 |
| Plot | Mito | Lyso or Perox | ER | Golgi | PM | Cytosol | Nucleus | ||||||
| Expt B |
5 peptides |
10 spectra |
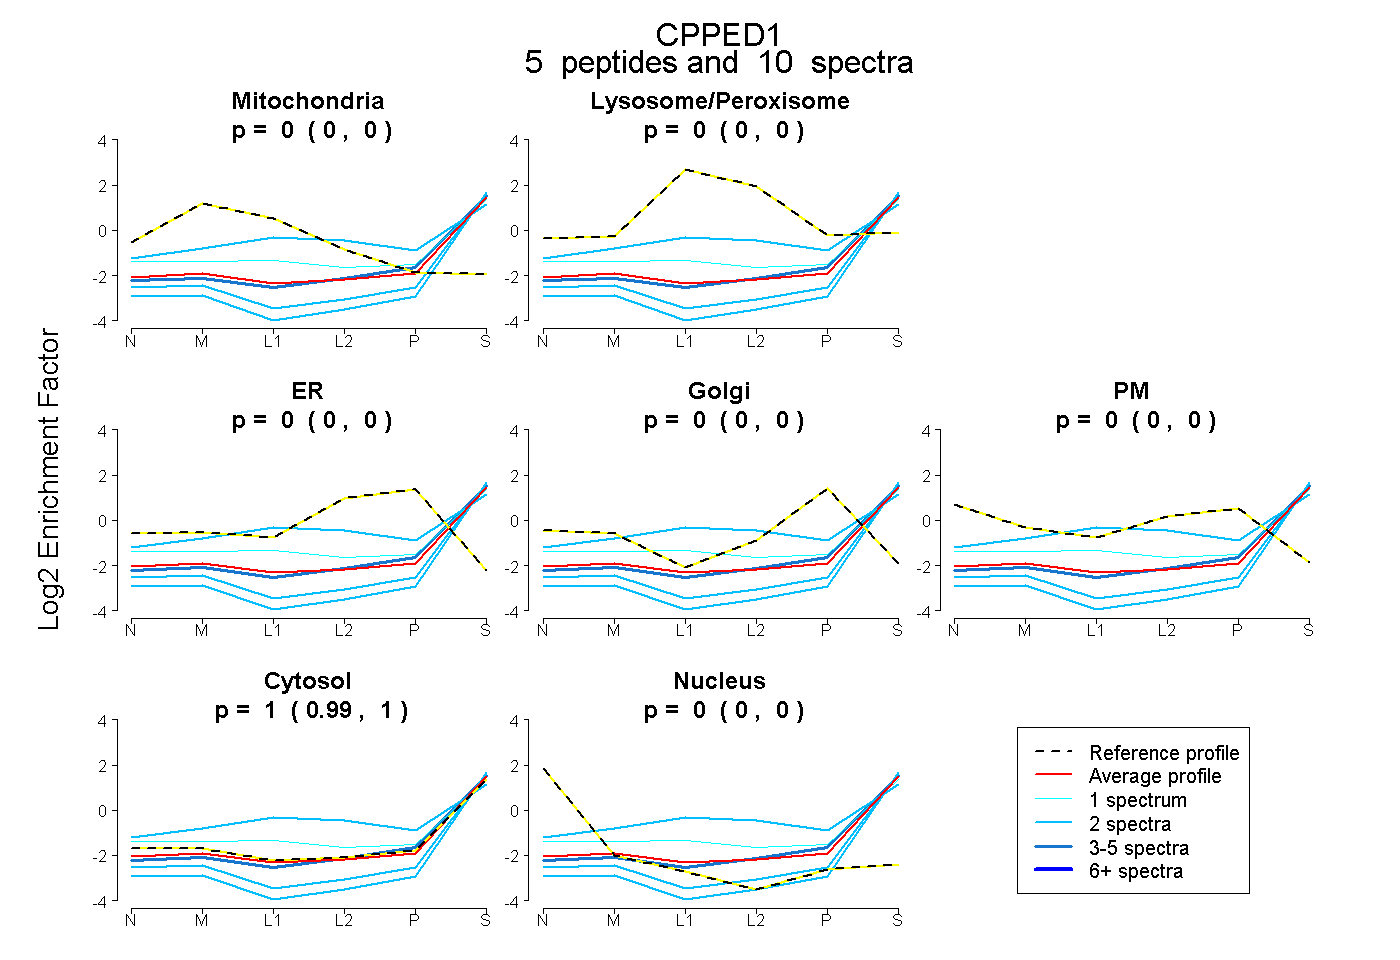 |
0.000 0.000 | 0.000 |
0.000 0.000 | 0.001 |
0.000 0.000 | 0.000 |
0.000 0.000 | 0.000 |
0.000 0.000 | 0.000 |
1.000 0.990 | 1.000 |
0.000 0.000 | 0.000 |
|||
| Plot | Lyso | Other | |||||||||||
| Expt C |
7 peptides |
27 spectra |
 |
0.000 0.000 | 0.000 |
1.000 1.000 | 1.000 |
||||||||
| Plot | Lyso | Other | |||||||||||
| Expt D |
2 peptides |
2 spectra |
 |
0.000 NA | NA |
1.000 NA | NA |