19
19peptides
spectra
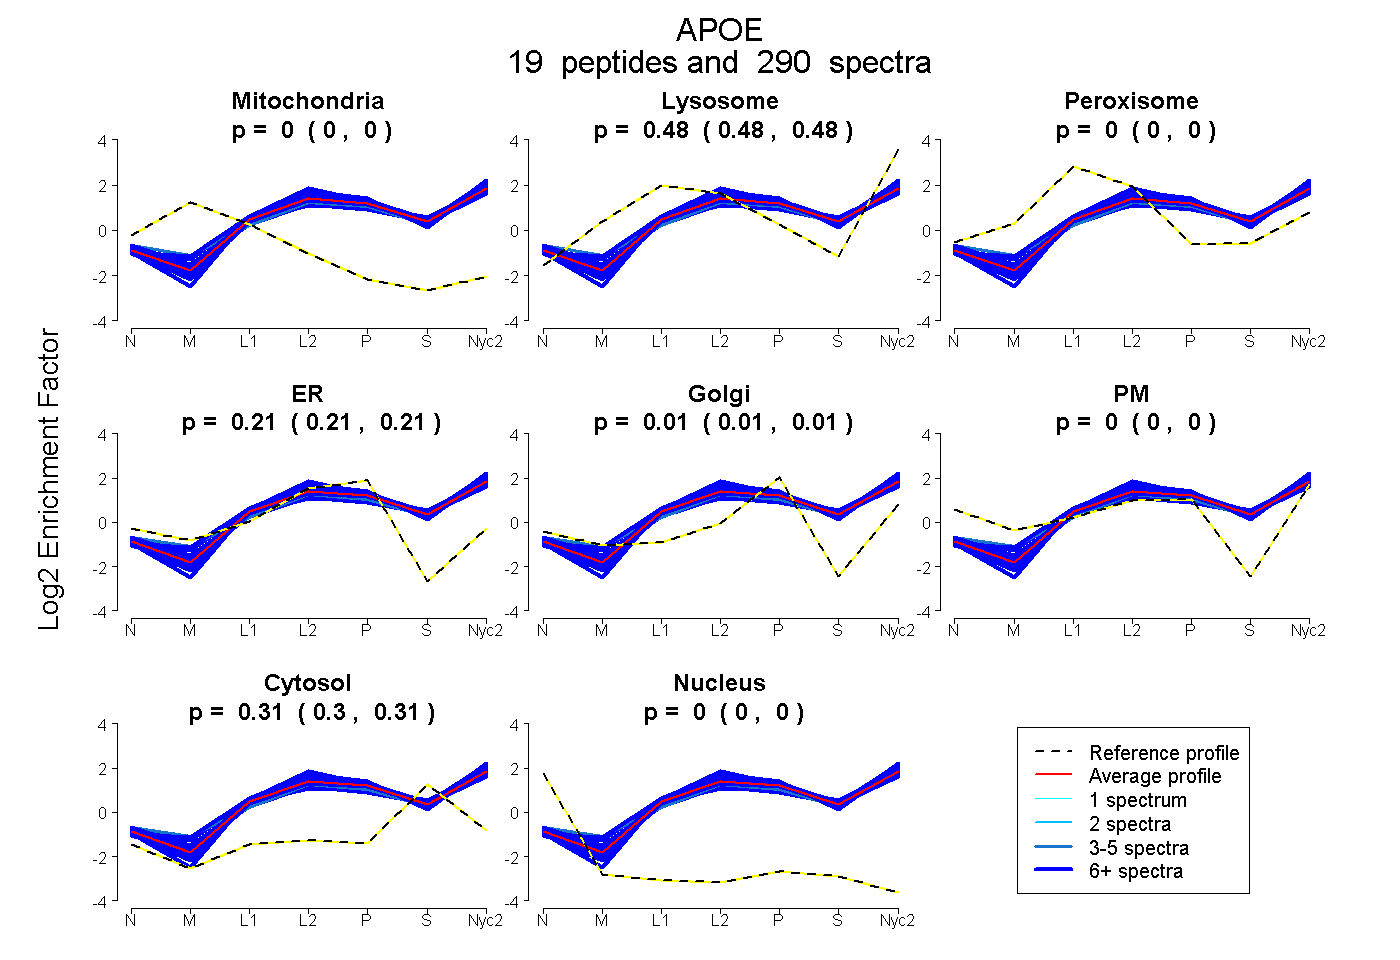
0.000 | 0.000
0.476 | 0.477
0.000 | 0.000
0.206 | 0.210
0.008 | 0.012
0.000 | 0.000
0.305 | 0.306
0.000 | 0.000
17peptides
spectra
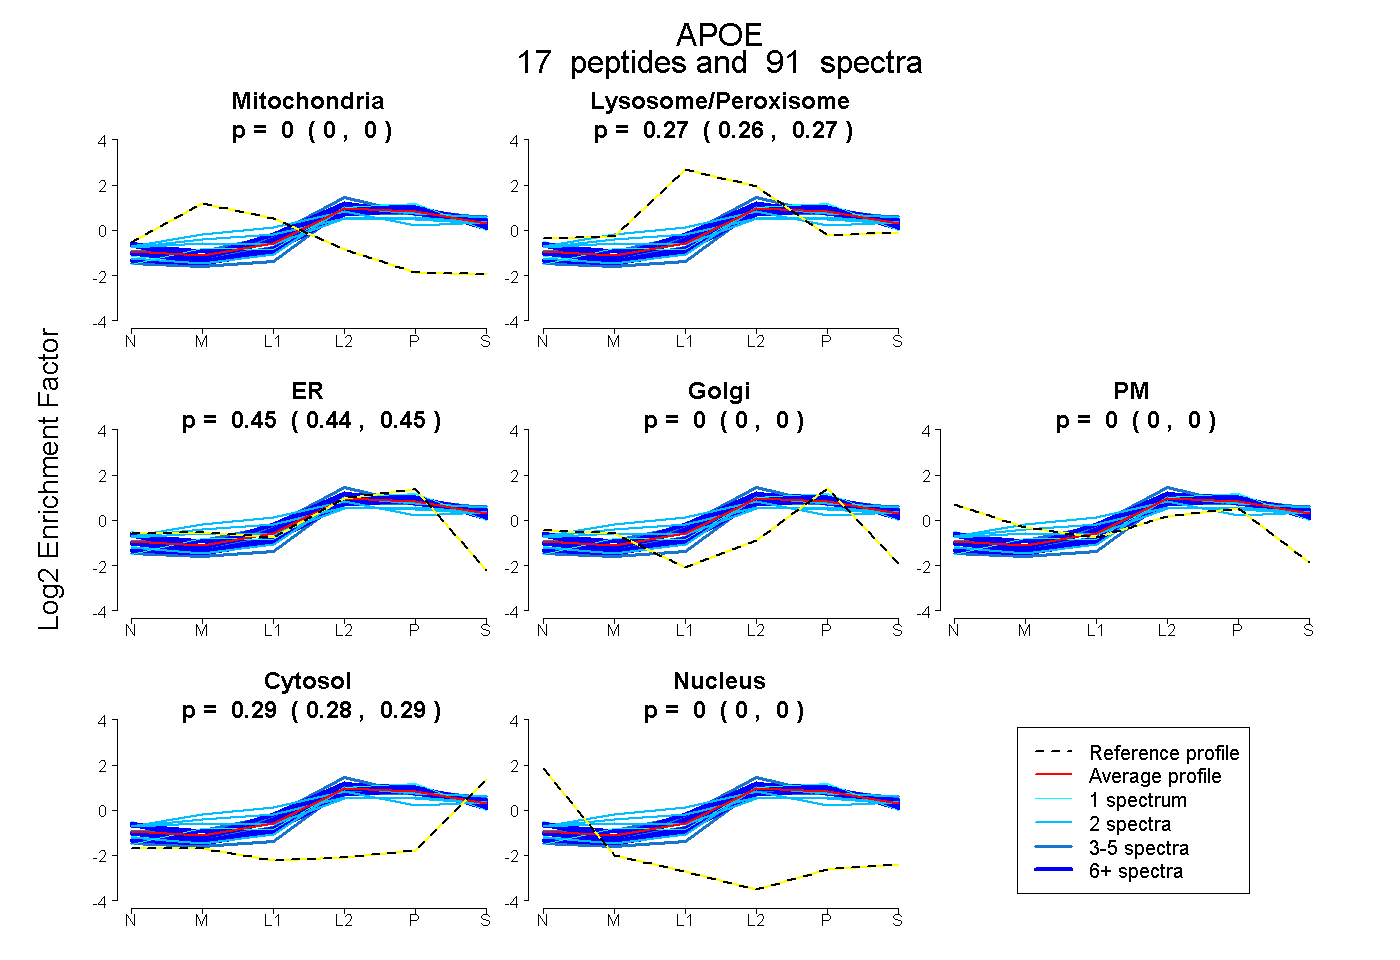
0.000 | 0.000
0.264 | 0.271
0.443 | 0.449
0.000 | 0.000
0.000 | 0.000
0.283 | 0.287
0.000 | 0.000