 2
2peptides
spectra
0.000 | 0.000
0.000 | 0.233
0.000 | 0.243
0.000 | 0.000
0.000 | 0.000
0.000 | 0.254
0.183 | 0.380
0.350 | 0.553
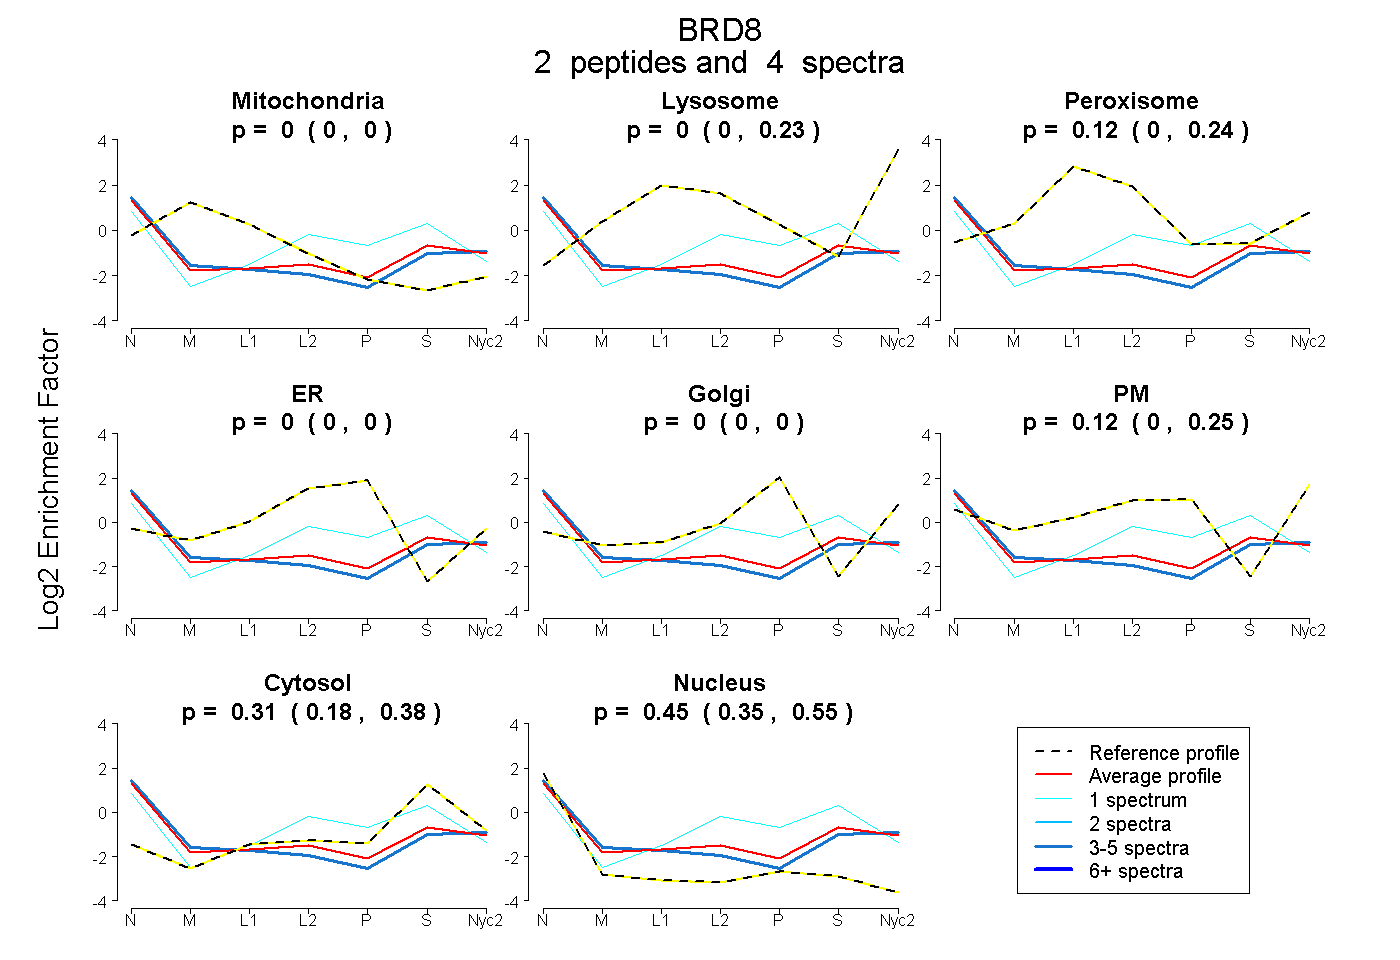
| Plot | Mito | Lyso | Perox | ER | Golgi | PM | Cytosol | Nucleus | |||||
| Expt A |
2 peptides |
4 spectra |
|
0.000 0.000 | 0.000 |
0.002 0.000 | 0.233 |
0.119 0.000 | 0.243 |
0.000 0.000 | 0.000 |
0.000 0.000 | 0.000 |
0.119 0.000 | 0.254 |
0.310 0.183 | 0.380 |
0.450 0.350 | 0.553 |
| 1 spectrum, ATDAAYQAR | 0.000 | 0.000 | 0.021 | 0.182 | 0.000 | 0.057 | 0.537 | 0.204 | ||
| 3 spectra, LDFEESETK | 0.000 | 0.188 | 0.040 | 0.000 | 0.000 | 0.000 | 0.186 | 0.586 |