 2
2peptides
spectra
0.386 | 0.438
0.000 | 0.000
0.220 | 0.269
0.000 | 0.043
0.277 | 0.350
0.000 | 0.000
0.000 | 0.019
0.000 | 0.000
2peptides
spectra
0.000 | 0.000
1.000 | 1.000
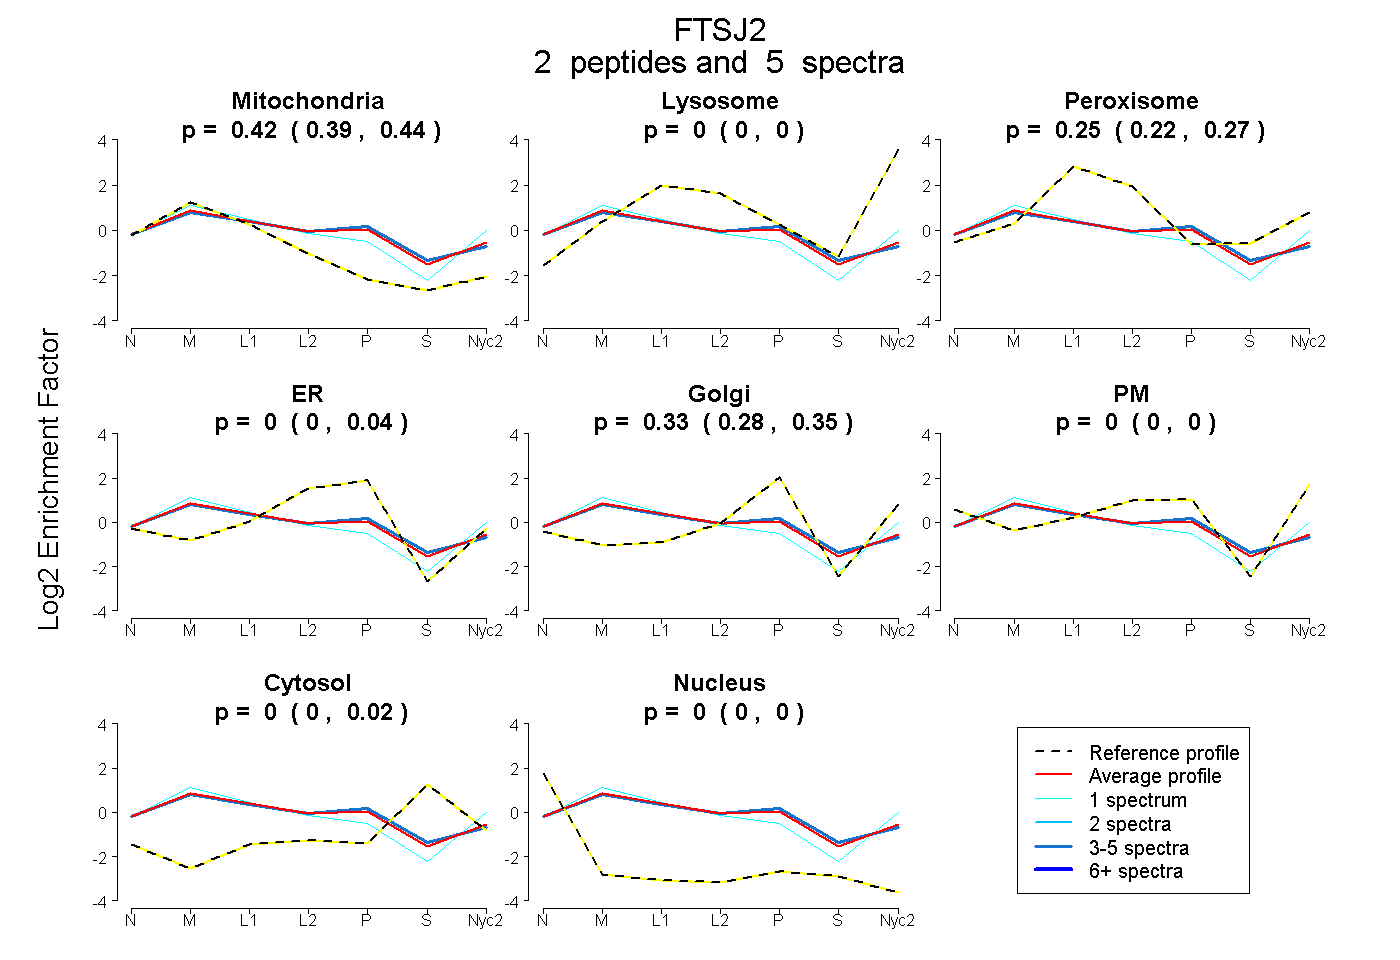
| Plot | Mito | Lyso | Perox | ER | Golgi | PM | Cytosol | Nucleus | |||||
| Expt A |
2 peptides |
5 spectra |
|
0.417 0.386 | 0.438 |
0.000 0.000 | 0.000 |
0.252 0.220 | 0.269 |
0.000 0.000 | 0.043 |
0.331 0.277 | 0.350 |
0.000 0.000 | 0.000 |
0.000 0.000 | 0.019 |
0.000 0.000 | 0.000 |
||
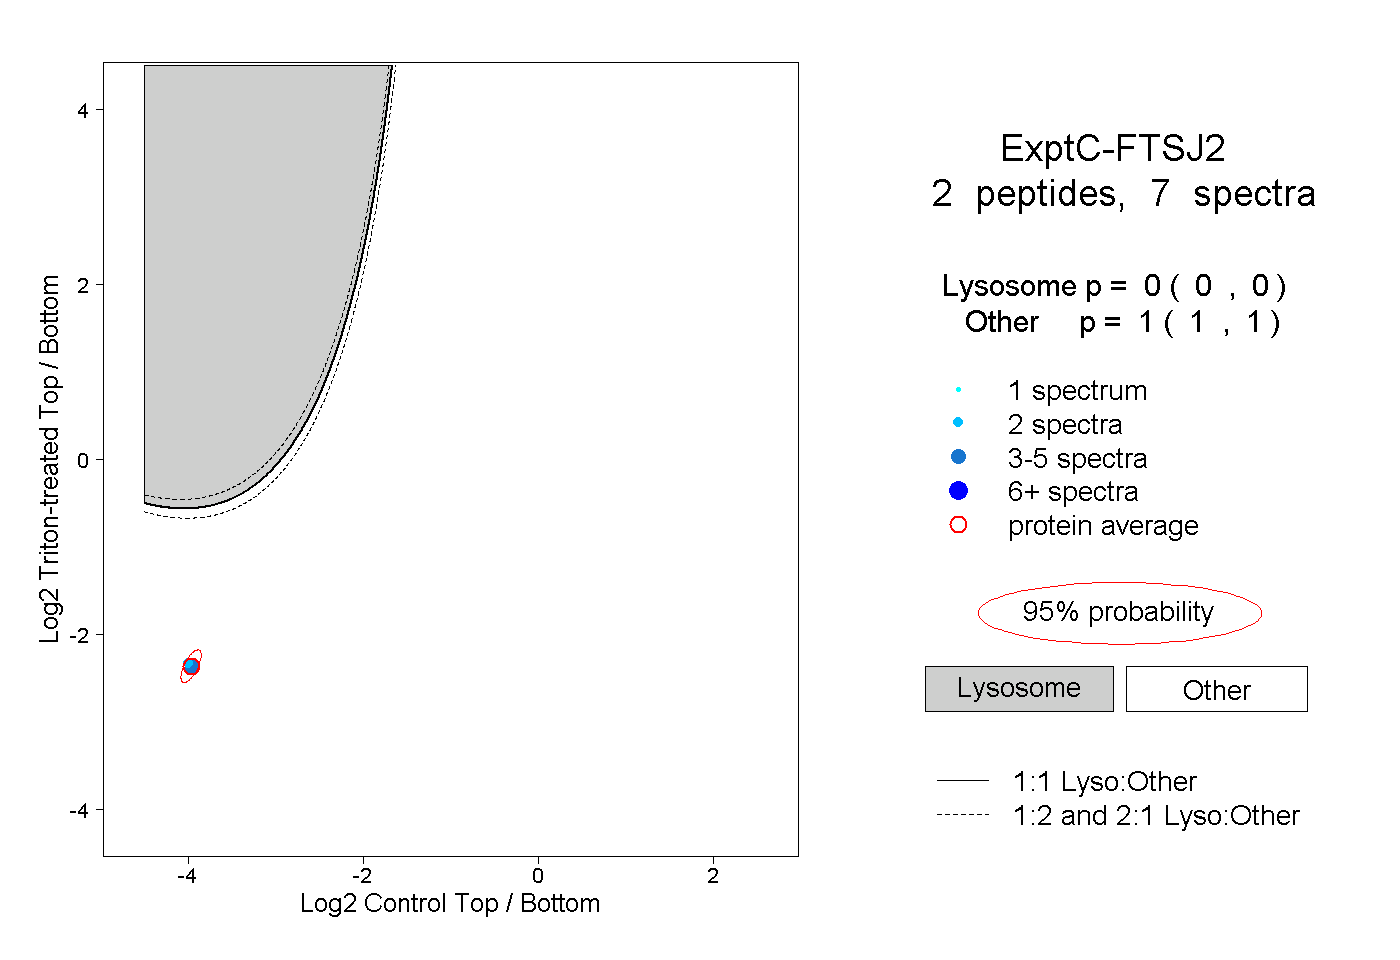
| Plot | Lyso | Other | |||||||||||
| Expt C |
2 peptides |
7 spectra |
|
0.000 0.000 | 0.000 |
1.000 1.000 | 1.000 |