 15
15peptides
spectra
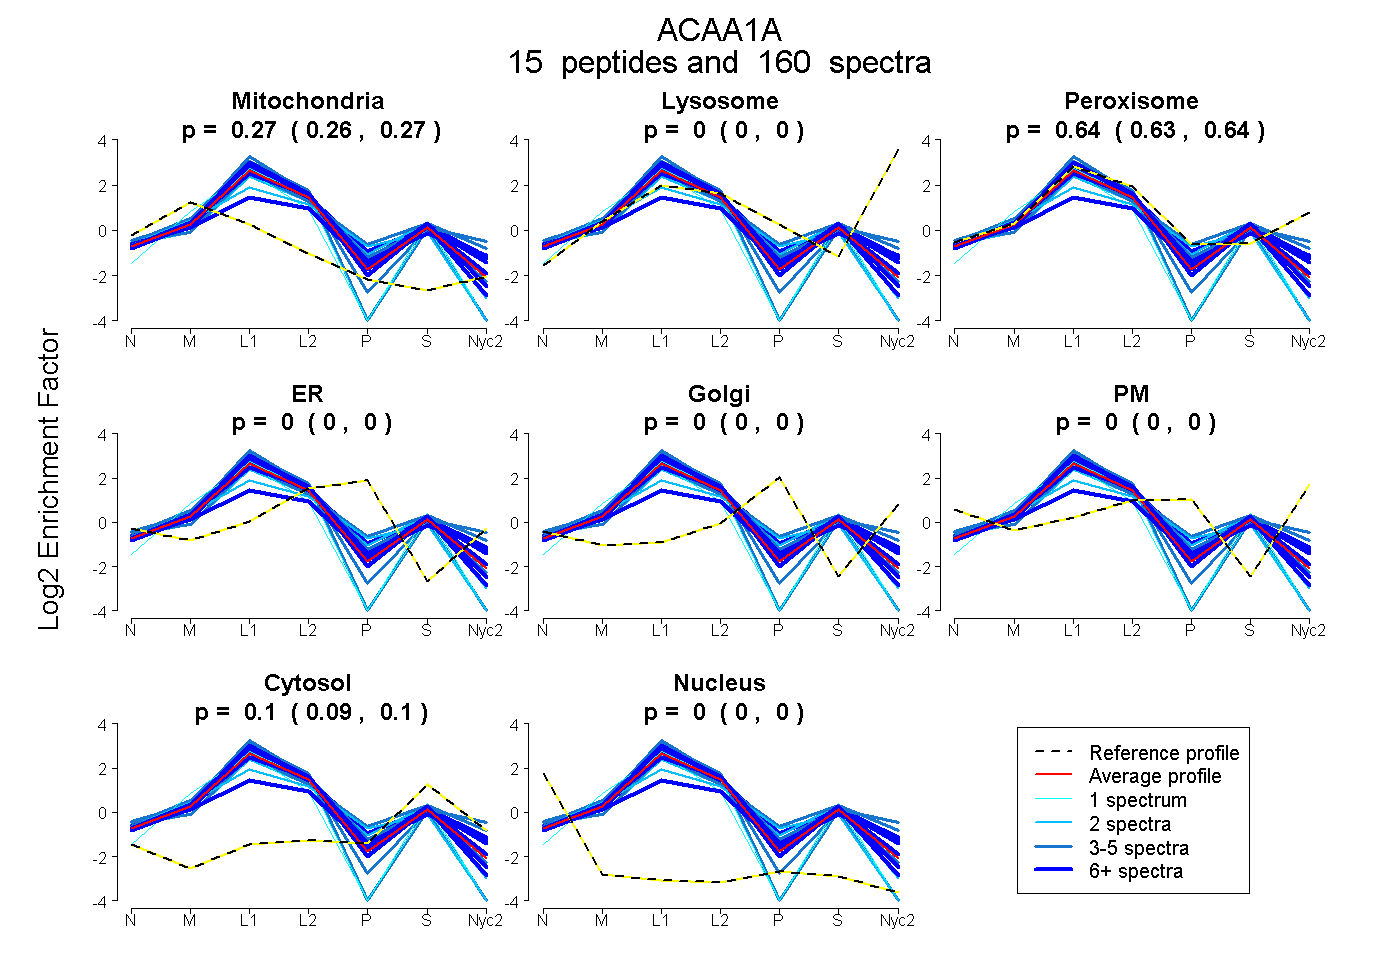
0.264 | 0.272
0.000 | 0.000
0.631 | 0.640
0.000 | 0.000
0.000 | 0.000
0.000 | 0.000
0.094 | 0.097
0.000 | 0.000
13peptides
spectra
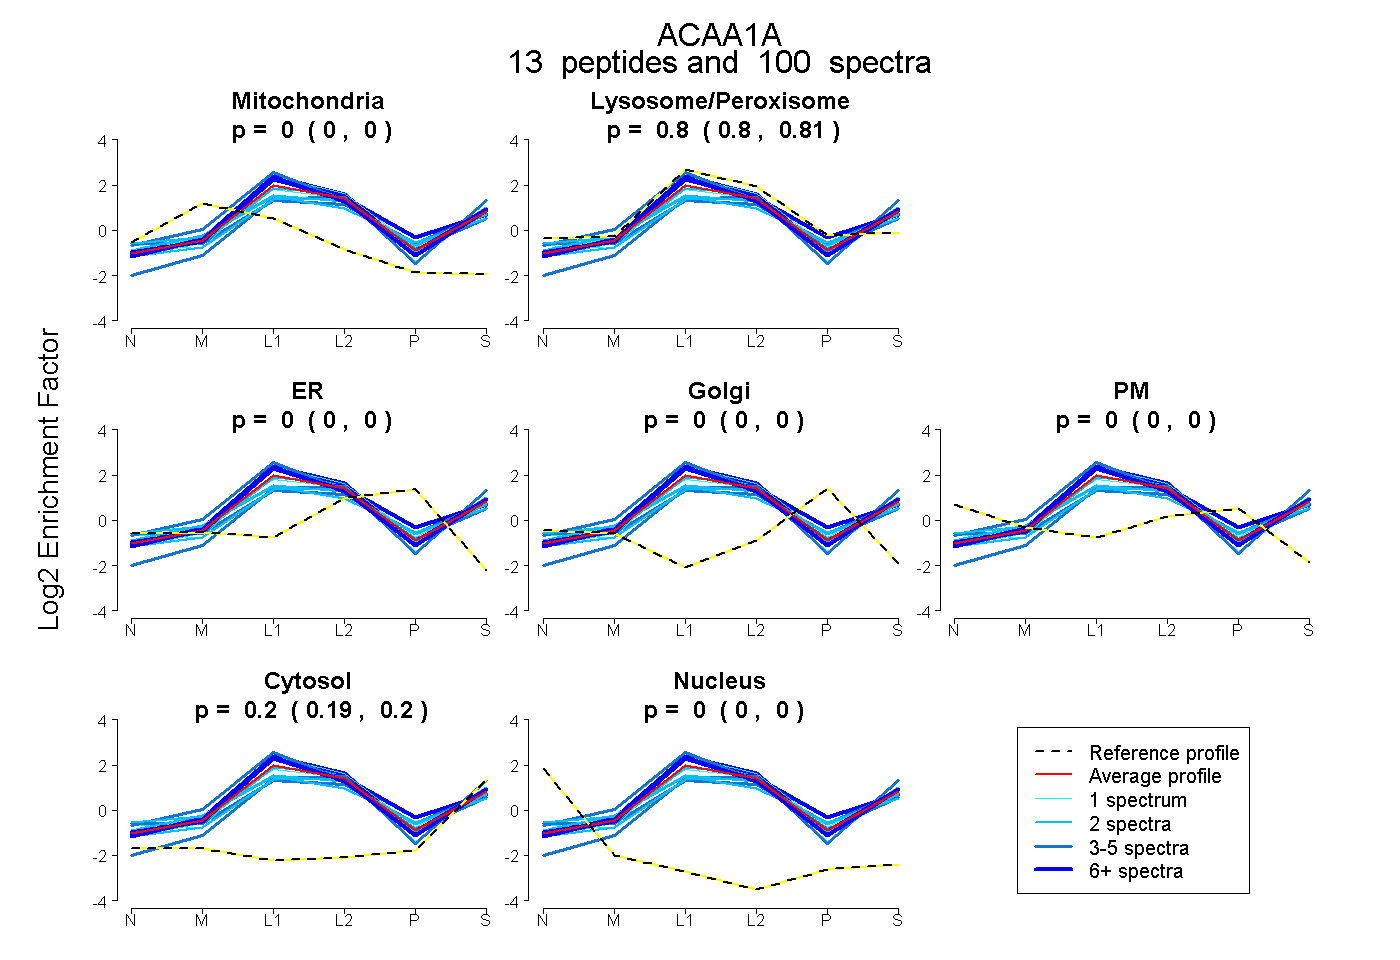
0.000 | 0.000
0.802 | 0.807
0.000 | 0.000
0.000 | 0.000
0.000 | 0.000
0.192 | 0.197
0.000 | 0.000
17peptides
spectra
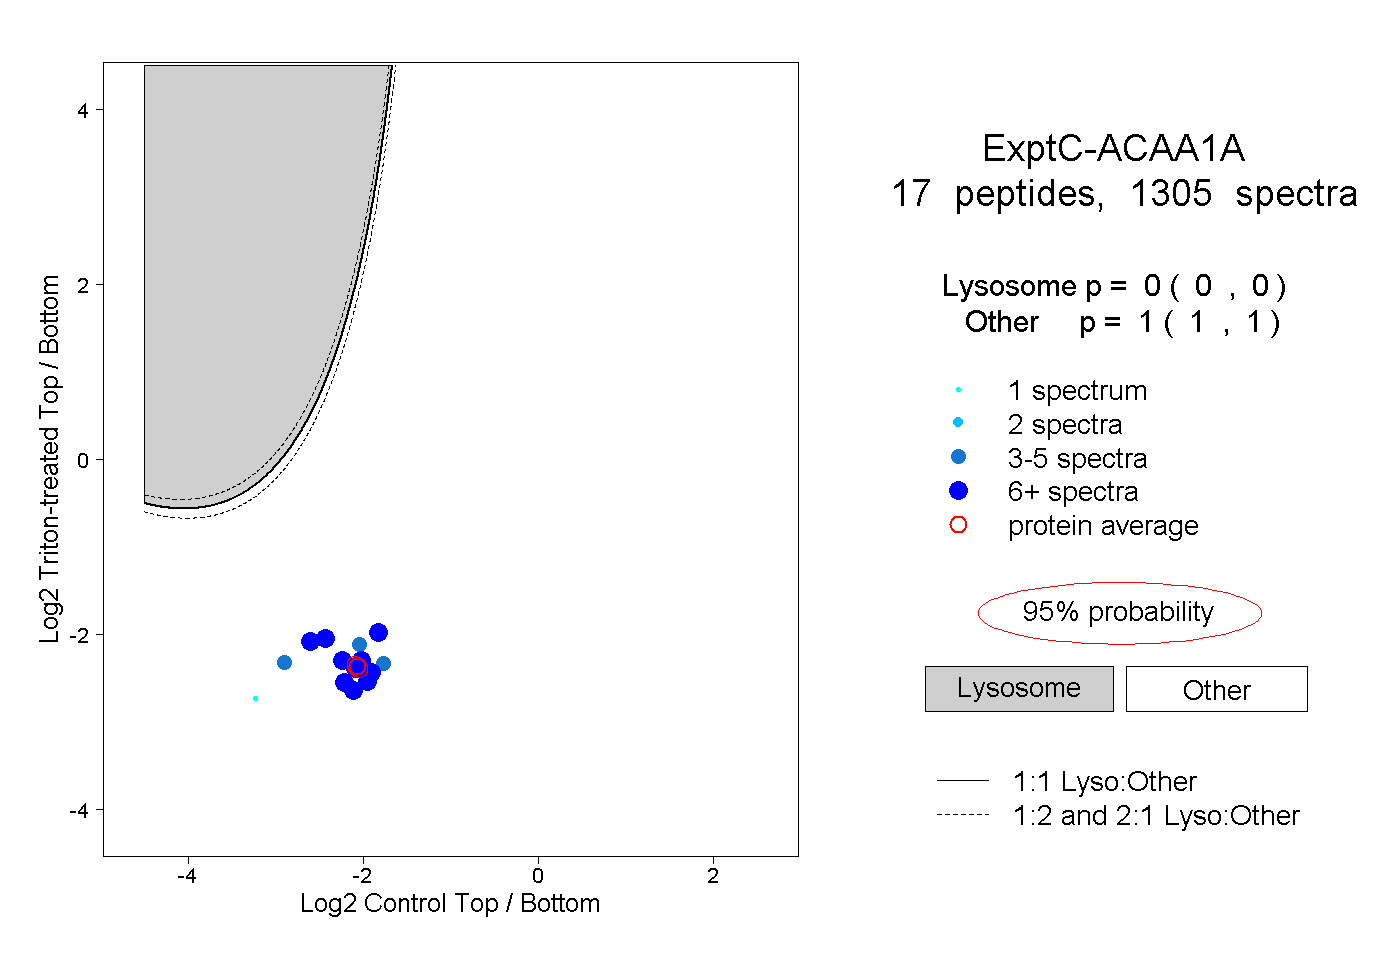
0.000 | 0.000
1.000 | 1.000
10peptides
spectra
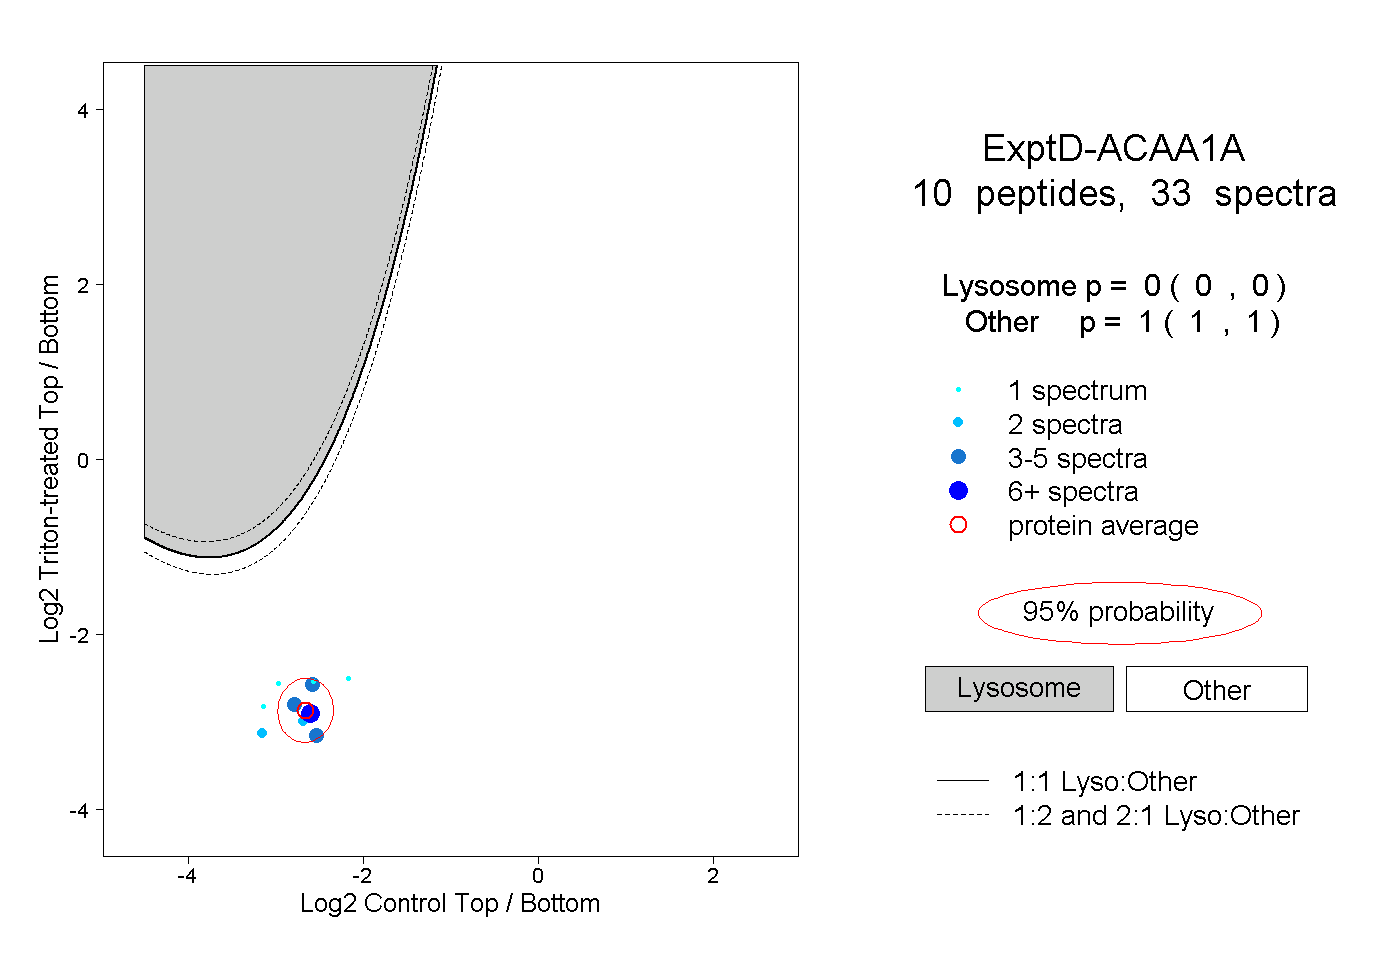
0.000 | 0.000
1.000 | 1.000