 15
15peptides
spectra
0.264 | 0.272
0.000 | 0.000
0.631 | 0.640
0.000 | 0.000
0.000 | 0.000
0.000 | 0.000
0.094 | 0.097
0.000 | 0.000
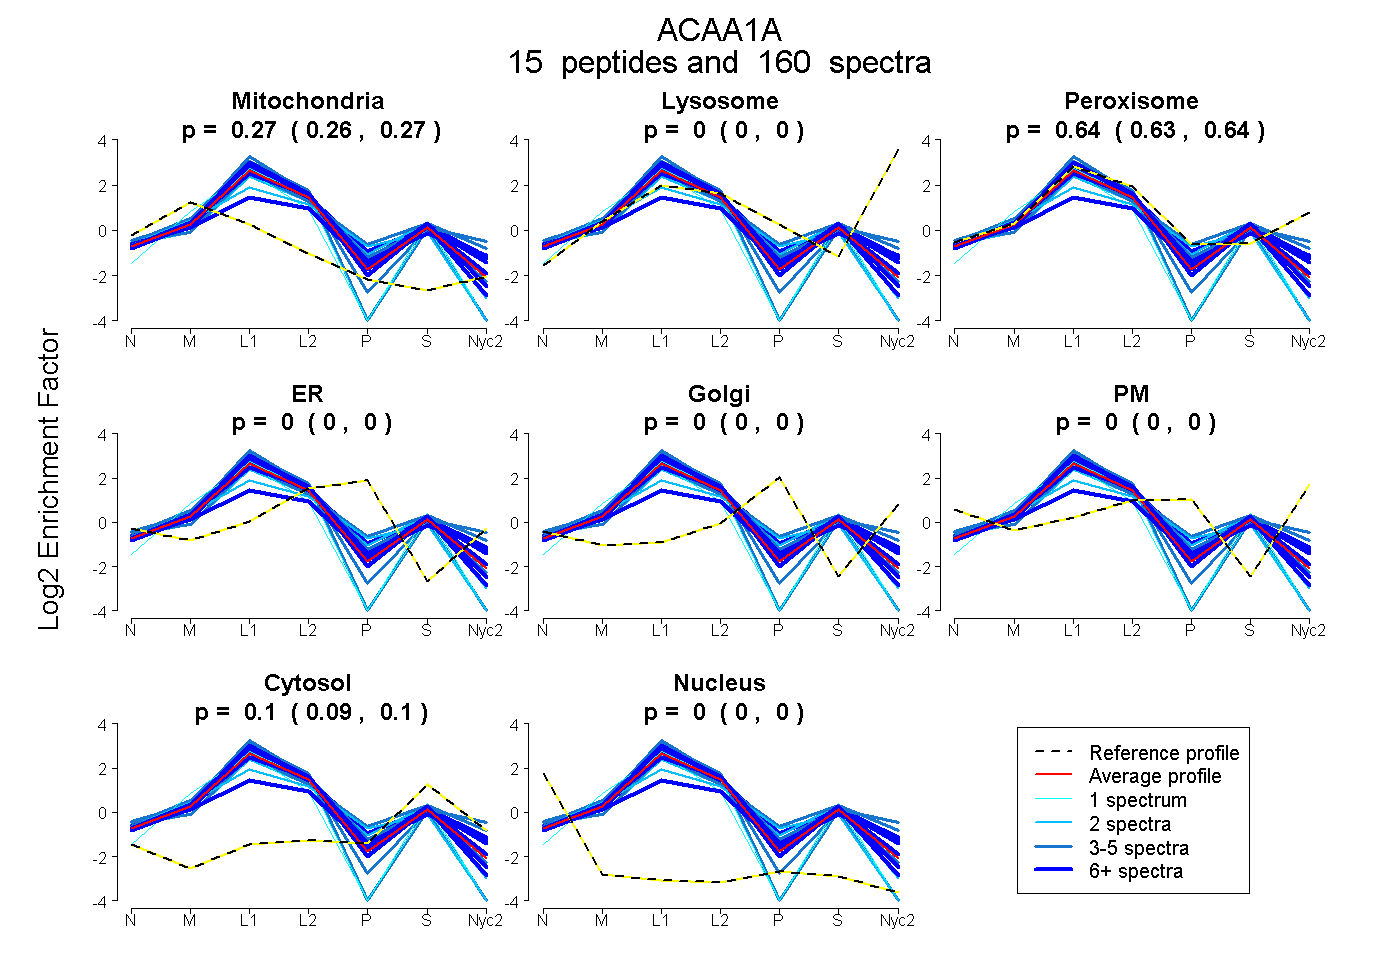
| Plot | Mito | Lyso | Perox | ER | Golgi | PM | Cytosol | Nucleus | |||||
| Expt A |
15 peptides |
160 spectra |
|
0.268 0.264 | 0.272 |
0.000 0.000 | 0.000 |
0.636 0.631 | 0.640 |
0.000 0.000 | 0.000 |
0.000 0.000 | 0.000 |
0.000 0.000 | 0.000 |
0.096 0.094 | 0.097 |
0.000 0.000 | 0.000 |
| 9 spectra, TITVSQDEGVRPSTTMEGLAK | 0.249 | 0.000 | 0.666 | 0.000 | 0.000 | 0.000 | 0.084 | 0.000 | ||
| 1 spectrum, DTTPDELLSAVLTAVLQDVK | 0.542 | 0.000 | 0.379 | 0.000 | 0.000 | 0.000 | 0.079 | 0.000 | ||
| 5 spectra, ILESDK | 0.056 | 0.000 | 0.774 | 0.000 | 0.000 | 0.000 | 0.170 | 0.000 | ||
| 2 spectra, AEIVPVTTTVLDDK | 0.281 | 0.000 | 0.540 | 0.000 | 0.000 | 0.000 | 0.179 | 0.000 | ||
| 3 spectra, QDAFALASQQK | 0.094 | 0.000 | 0.803 | 0.000 | 0.000 | 0.000 | 0.103 | 0.000 | ||
| 9 spectra, QVVTLLNELK | 0.200 | 0.000 | 0.724 | 0.000 | 0.000 | 0.000 | 0.075 | 0.000 | ||
| 1 spectrum, LKPECLGDISVGNVLEPGAGAVMAR | 0.641 | 0.000 | 0.296 | 0.000 | 0.000 | 0.000 | 0.063 | 0.000 | ||
| 6 spectra, QCSSGLQAVANIAGGIR | 0.224 | 0.000 | 0.534 | 0.000 | 0.000 | 0.000 | 0.242 | 0.000 | ||
| 2 spectra, NGSYDIGMACGVESMSLSNR | 0.481 | 0.000 | 0.394 | 0.000 | 0.000 | 0.000 | 0.125 | 0.000 | ||
| 27 spectra, VNPLGGAIALGHPLGCTGAR | 0.340 | 0.000 | 0.600 | 0.000 | 0.000 | 0.000 | 0.060 | 0.000 | ||
| 4 spectra, AASAQSK | 0.343 | 0.000 | 0.655 | 0.000 | 0.000 | 0.000 | 0.002 | 0.000 | ||
| 22 spectra, AEELGLPILGVLR | 0.139 | 0.000 | 0.768 | 0.000 | 0.000 | 0.000 | 0.093 | 0.000 | ||
| 16 spectra, DCLIPMGITSENVAER | 0.171 | 0.000 | 0.713 | 0.000 | 0.000 | 0.000 | 0.116 | 0.000 | ||
| 4 spectra, DGGSTTAGNSSQVSDGAAAVLLAR | 0.568 | 0.000 | 0.432 | 0.000 | 0.000 | 0.000 | 0.000 | 0.000 | ||
| 49 spectra, GNPGNISSR | 0.233 | 0.000 | 0.709 | 0.000 | 0.000 | 0.000 | 0.058 | 0.000 |
| Plot | Mito | Lyso or Perox | ER | Golgi | PM | Cytosol | Nucleus | ||||||
| Expt B |
13 peptides |
100 spectra |
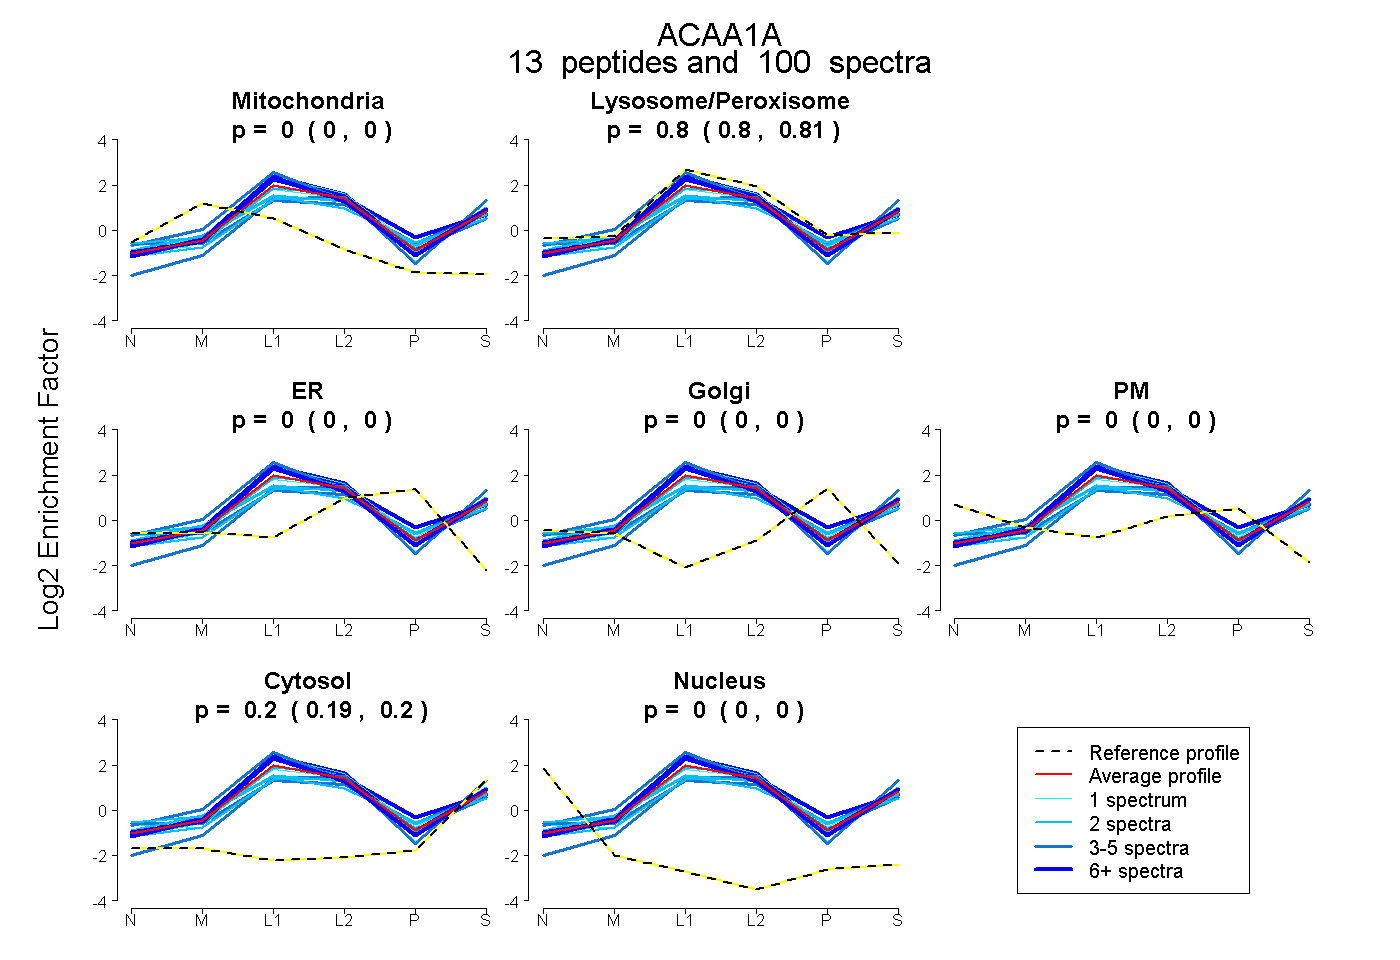 |
0.000 0.000 | 0.000 |
0.805 0.802 | 0.807 |
0.000 0.000 | 0.000 |
0.000 0.000 | 0.000 |
0.000 0.000 | 0.000 |
0.195 0.192 | 0.197 |
0.000 0.000 | 0.000 |
|||
| Plot | Lyso | Other | |||||||||||
| Expt C |
17 peptides |
1305 spectra |
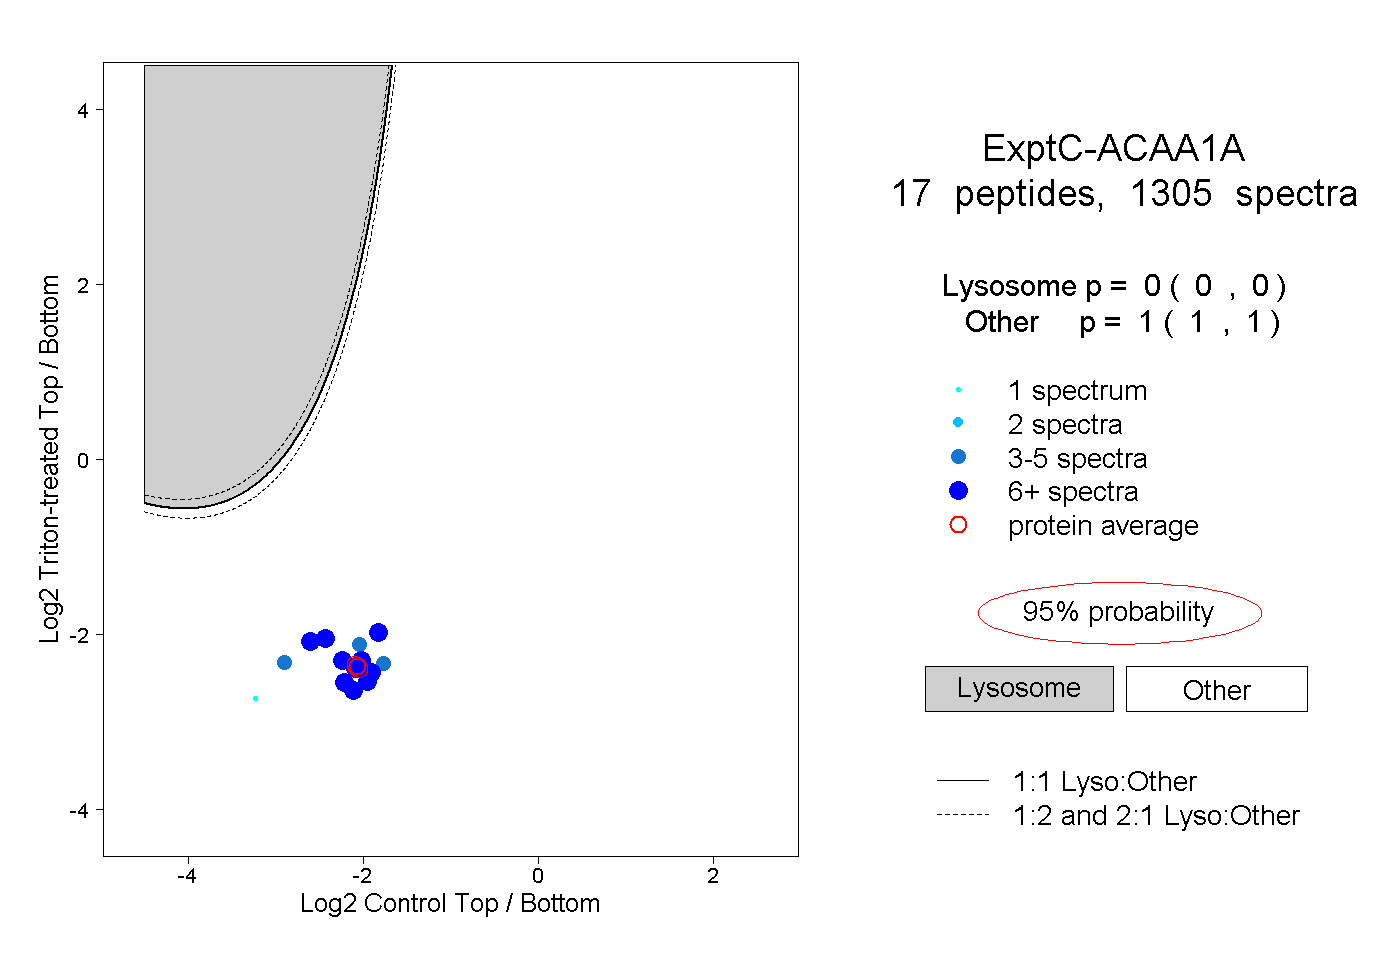 |
0.000 0.000 | 0.000 |
1.000 1.000 | 1.000 |
||||||||
| Plot | Lyso | Other | |||||||||||
| Expt D |
10 peptides |
33 spectra |
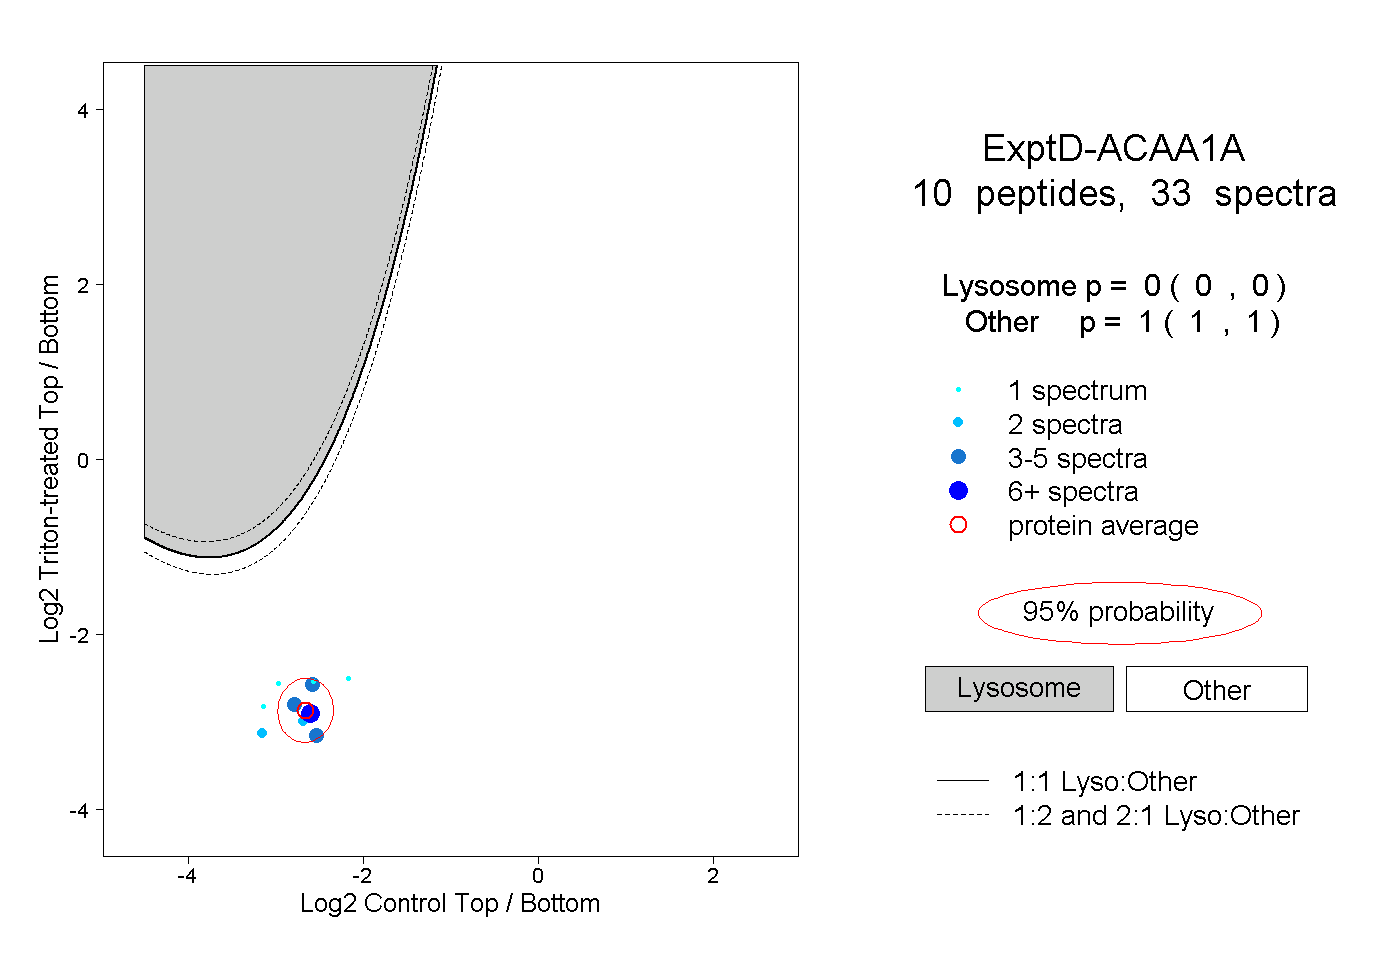 |
0.000 0.000 | 0.000 |
1.000 1.000 | 1.000 |