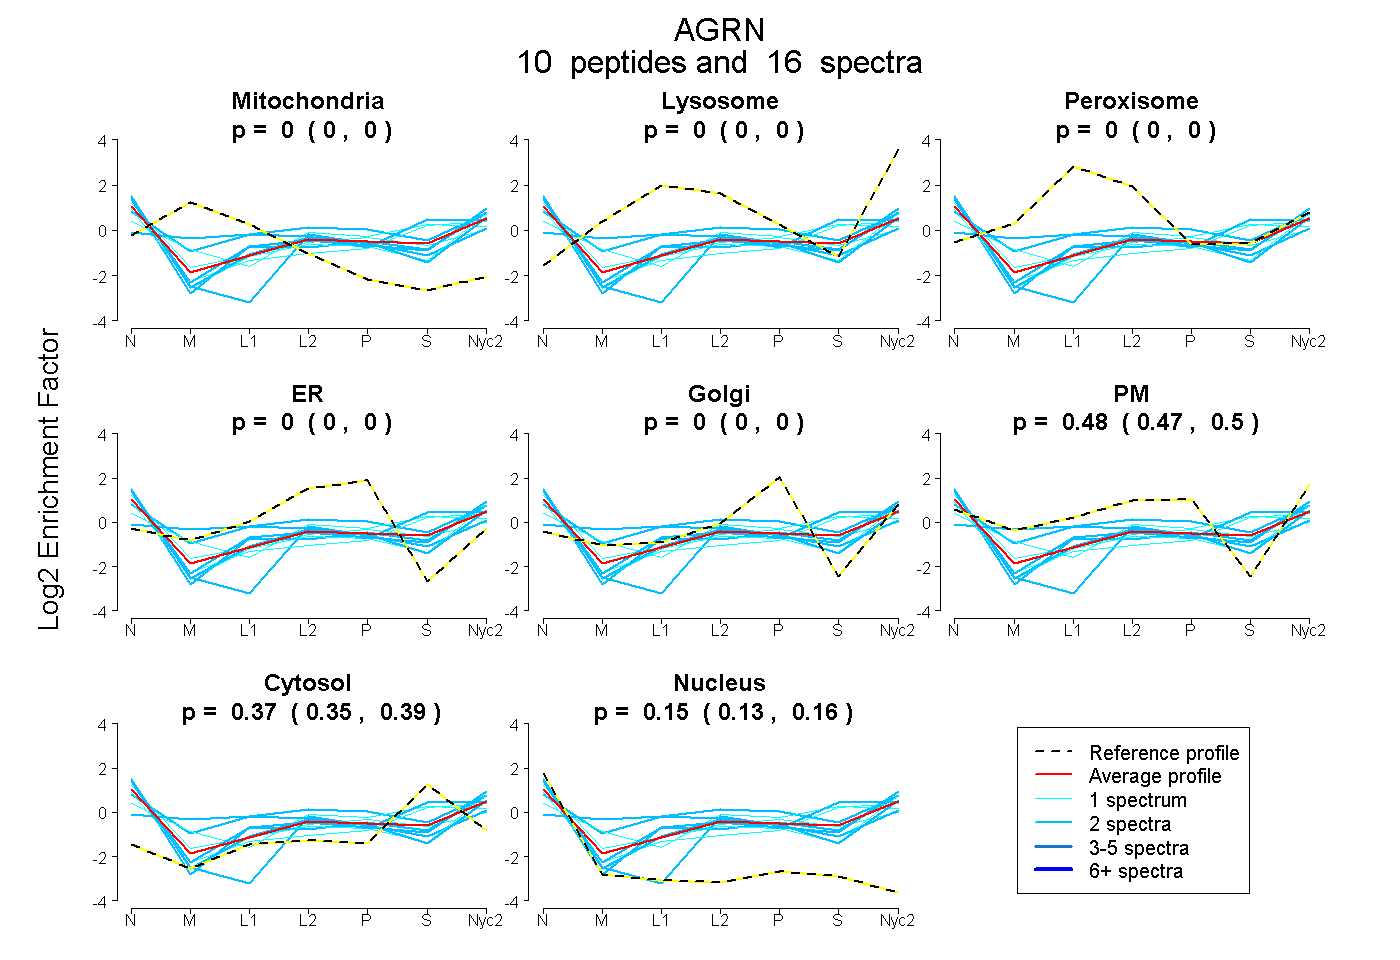
 10
10peptides
spectra
0.000 | 0.000
0.000 | 0.000
0.000 | 0.000
0.000 | 0.000
0.000 | 0.000
0.470 | 0.495
0.348 | 0.386
0.133 | 0.158
| Plot | Mito | Lyso | Perox | ER | Golgi | PM | Cytosol | Nucleus | |||||
| Expt A |
10 peptides |
16 spectra |
|
0.000 0.000 | 0.000 |
0.000 0.000 | 0.000 |
0.000 0.000 | 0.000 |
0.000 0.000 | 0.000 |
0.000 0.000 | 0.000 |
0.484 0.470 | 0.495 |
0.369 0.348 | 0.386 |
0.147 0.133 | 0.158 |
| 1 spectrum, LALEFR | 0.000 | 0.000 | 0.000 | 0.000 | 0.000 | 0.515 | 0.225 | 0.259 | ||
| 1 spectrum, HLEFCYDLGK | 0.000 | 0.000 | 0.000 | 0.000 | 0.000 | 0.436 | 0.527 | 0.038 | ||
| 2 spectra, GFTCSCTAGR | 0.000 | 0.000 | 0.000 | 0.000 | 0.050 | 0.360 | 0.256 | 0.334 | ||
| 2 spectra, FGPTCADEK | 0.000 | 0.000 | 0.089 | 0.000 | 0.000 | 0.557 | 0.322 | 0.032 | ||
| 2 spectra, VCTFGAVCSAGQCVCPR | 0.081 | 0.074 | 0.191 | 0.000 | 0.000 | 0.183 | 0.471 | 0.000 | ||
| 2 spectra, SPCQPNPCHGAAPCR | 0.000 | 0.000 | 0.000 | 0.000 | 0.000 | 0.543 | 0.204 | 0.253 | ||
| 2 spectra, GHSFLAFPTLR | 0.000 | 0.000 | 0.000 | 0.000 | 0.000 | 0.485 | 0.332 | 0.183 | ||
| 1 spectrum, GLLLQK | 0.000 | 0.000 | 0.000 | 0.000 | 0.000 | 0.325 | 0.548 | 0.127 | ||
| 2 spectra, SVGDLETLAFDGR | 0.000 | 0.000 | 0.000 | 0.000 | 0.000 | 0.535 | 0.303 | 0.162 | ||
| 1 spectrum, GDFVSLALHNR | 0.000 | 0.000 | 0.000 | 0.000 | 0.000 | 0.482 | 0.322 | 0.196 |
| Plot | Mito | Lyso or Perox | ER | Golgi | PM | Cytosol | Nucleus | ||||||
| Expt B |
1 peptide |
2 spectra |
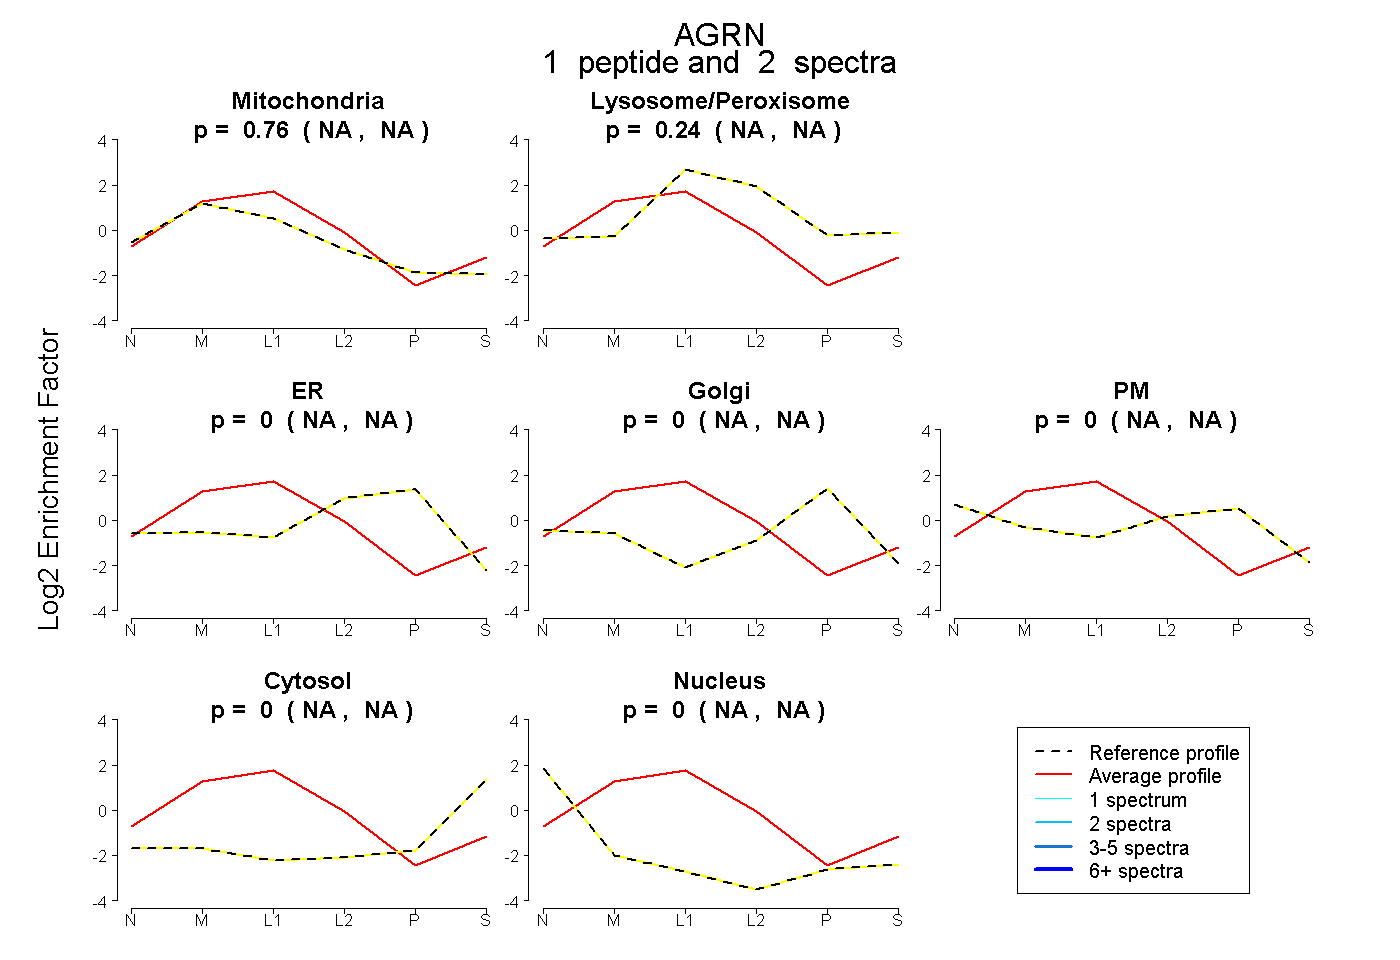 |
0.758 NA | NA |
0.242 NA | NA |
0.000 NA | NA |
0.000 NA | NA |
0.000 NA | NA |
0.000 NA | NA |
0.000 NA | NA |
|||
| Plot | Lyso | Other | |||||||||||
| Expt C |
3 peptides |
9 spectra |
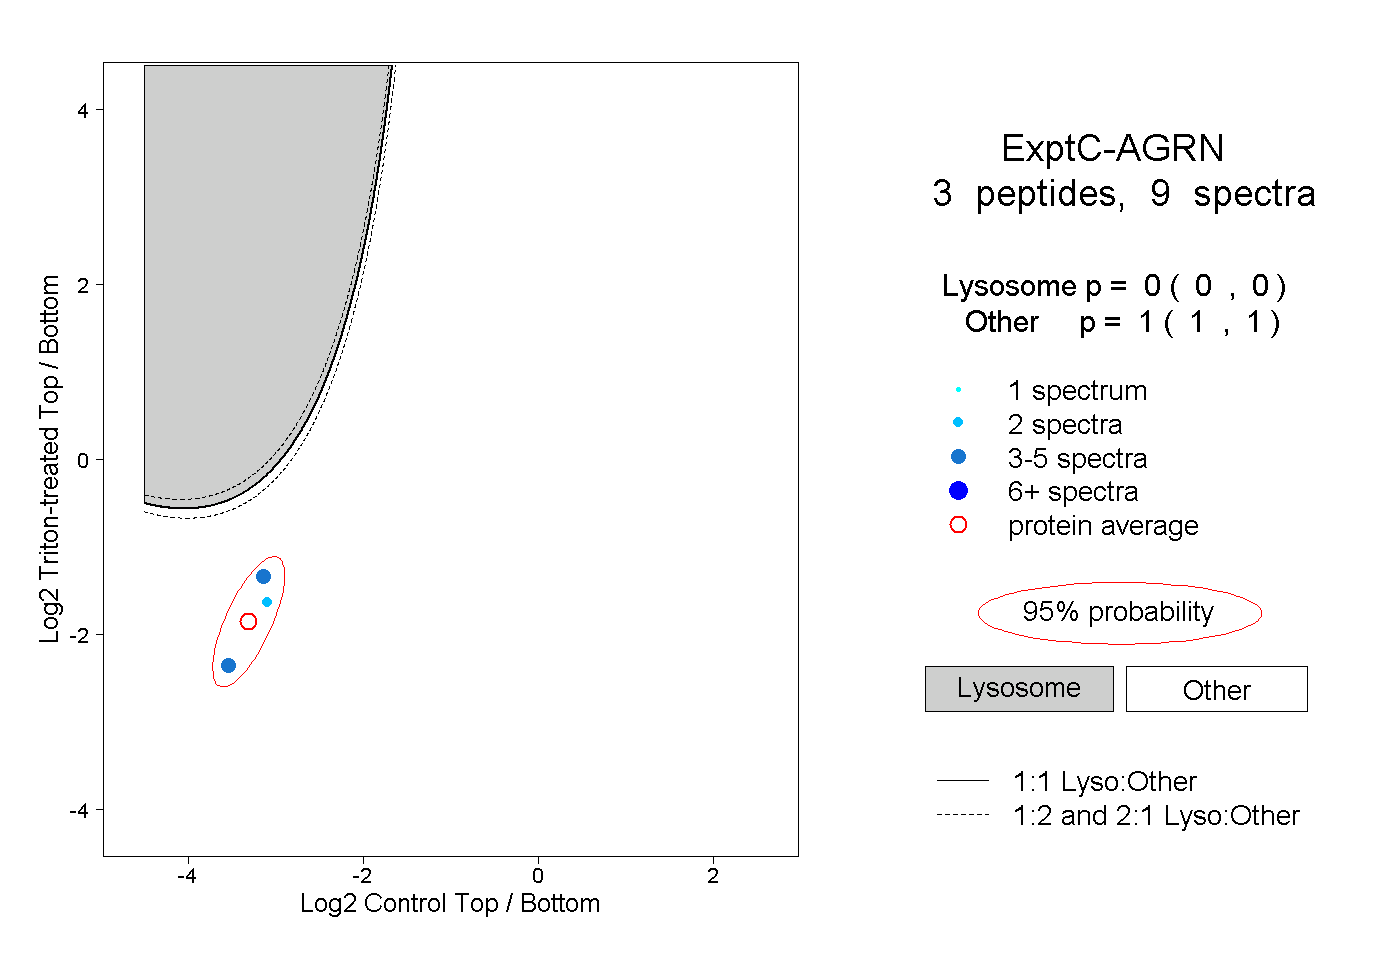 |
0.000 0.000 | 0.000 |
1.000 1.000 | 1.000 |