 14
14peptides
spectra
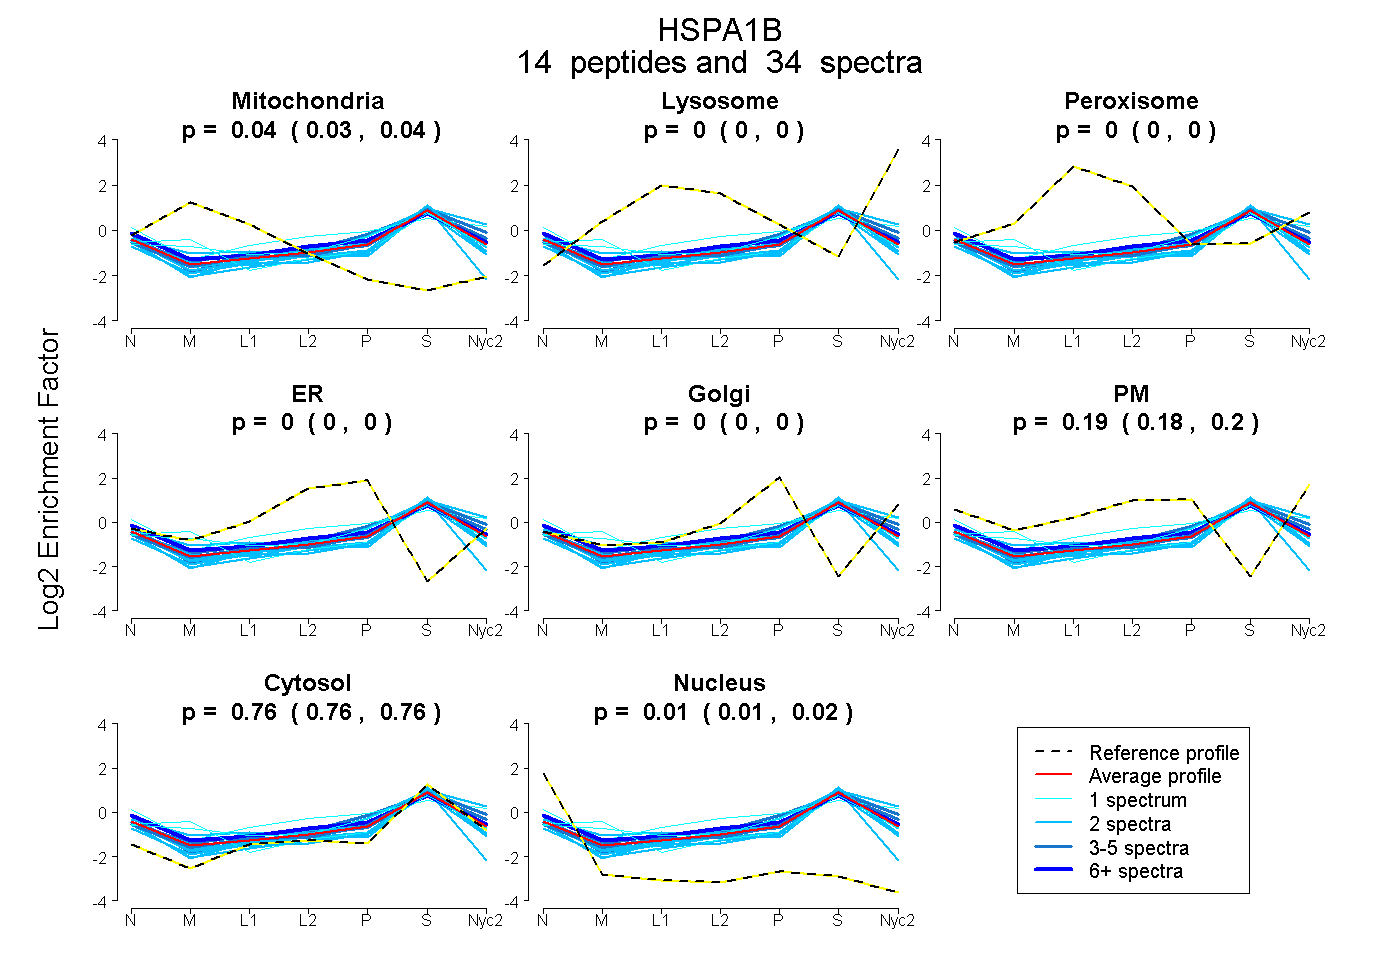
0.029 | 0.044
0.000 | 0.000
0.000 | 0.000
0.000 | 0.000
0.000 | 0.003
0.180 | 0.195
0.757 | 0.763
0.009 | 0.017
2peptides
spectra
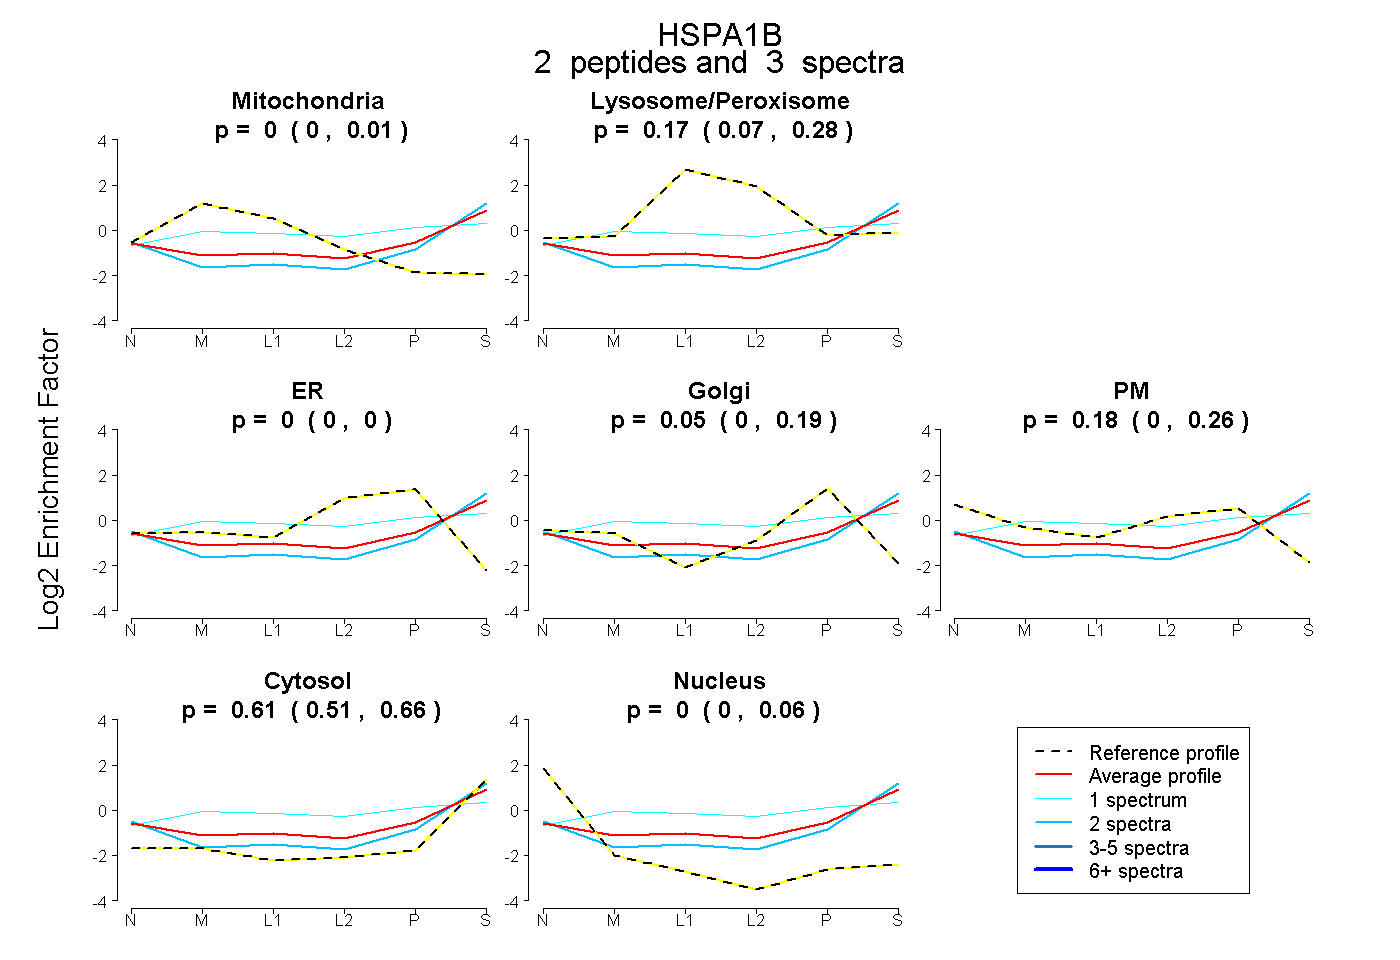
0.000 | 0.006
0.066 | 0.278
0.000 | 0.000
0.000 | 0.195
0.000 | 0.257
0.513 | 0.661
0.000 | 0.063
11peptides
spectra
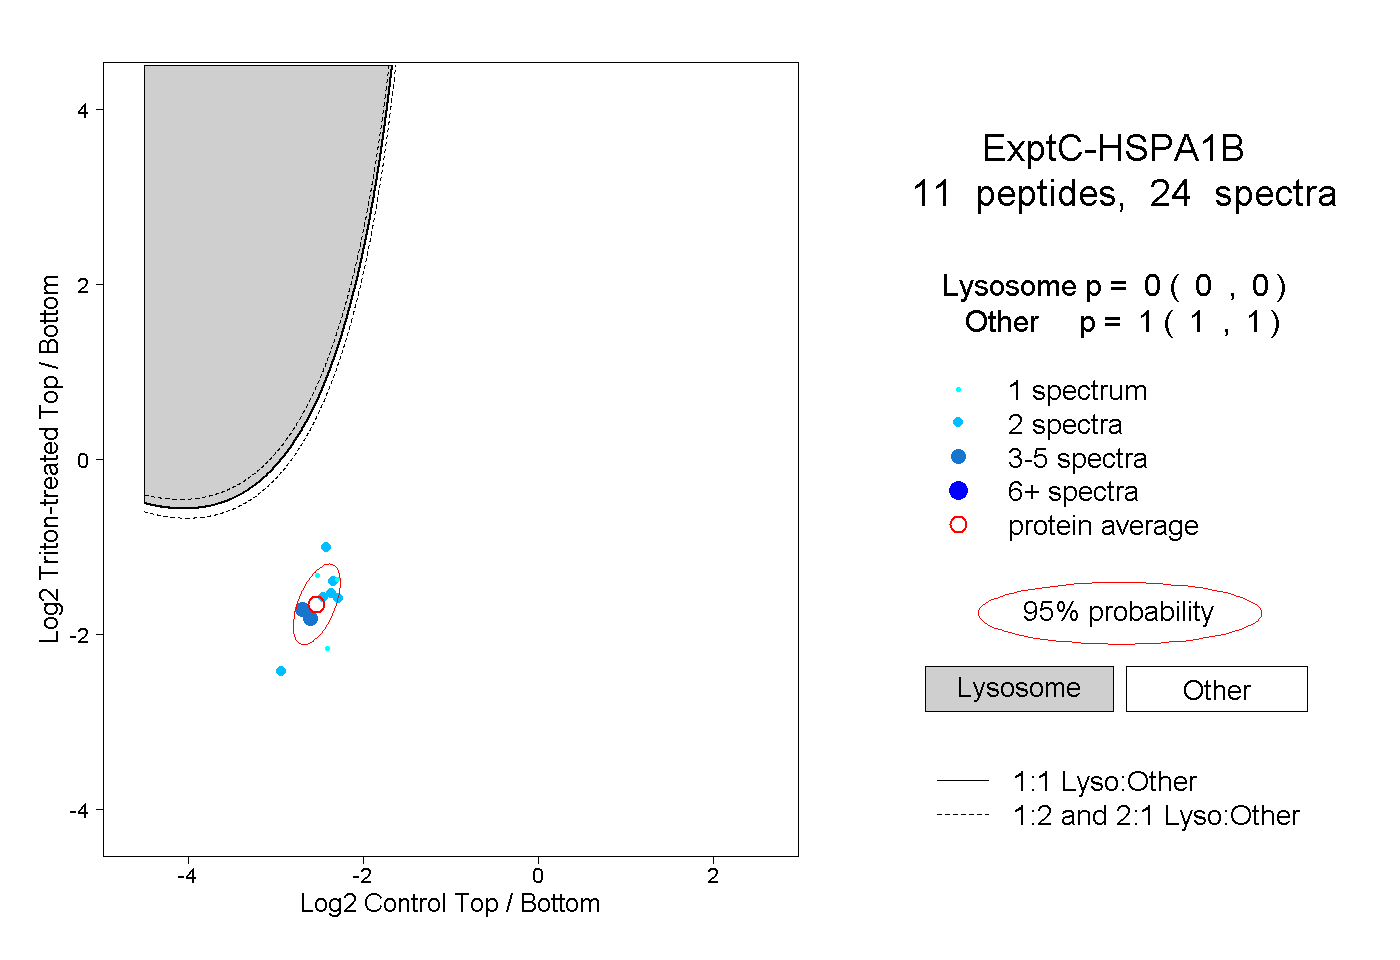
0.000 | 0.000
1.000 | 1.000