 2
2peptides
spectra
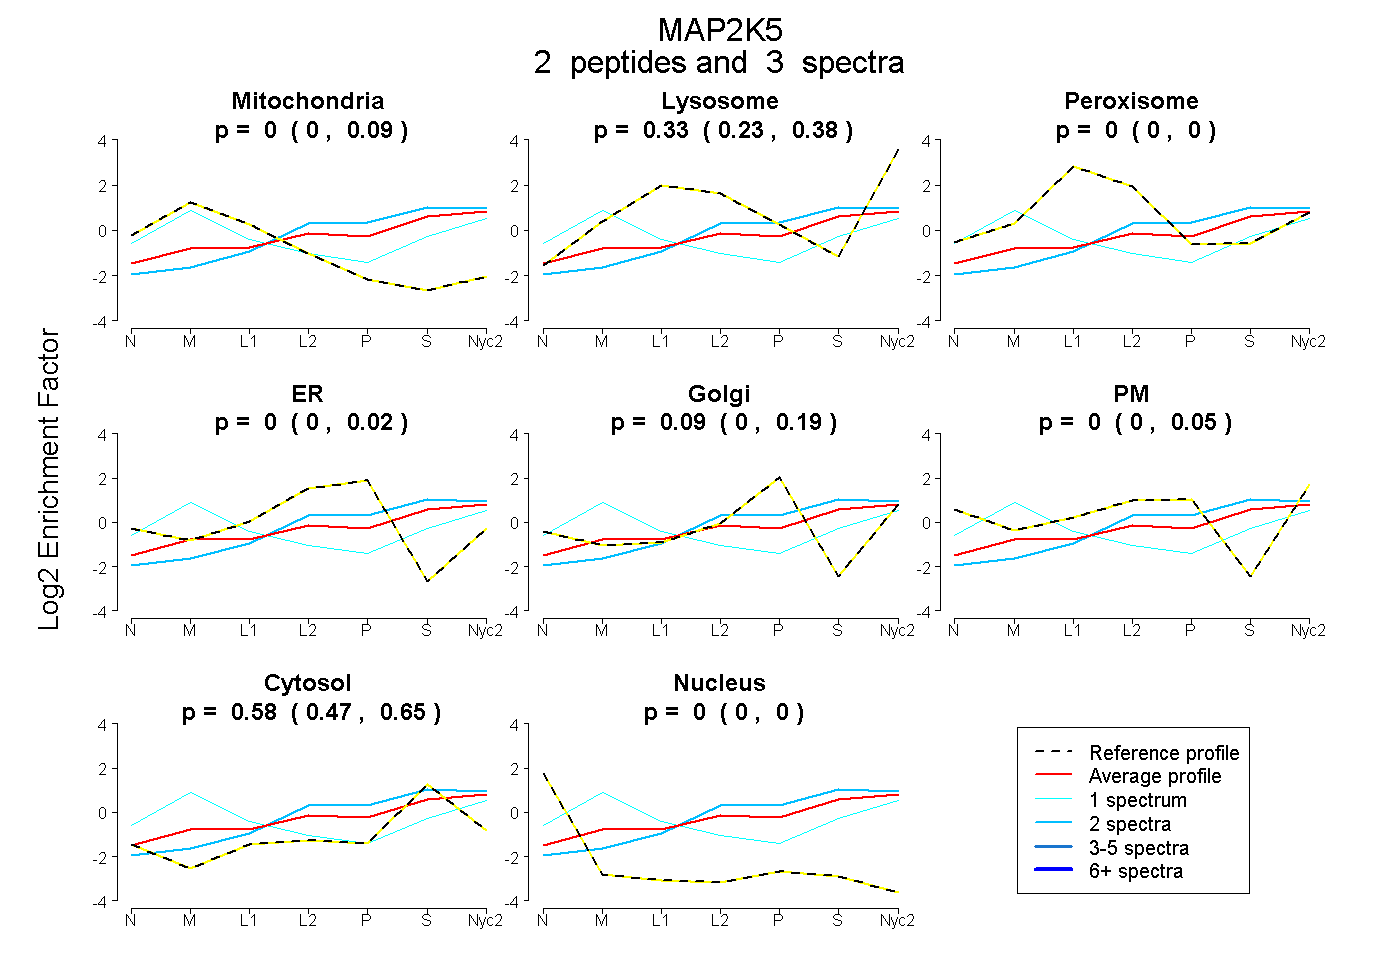
0.000 | 0.087
0.228 | 0.385
0.000 | 0.000
0.000 | 0.024
0.000 | 0.193
0.000 | 0.053
0.467 | 0.653
0.000 | 0.000
| Plot | Mito | Lyso | Perox | ER | Golgi | PM | Cytosol | Nucleus | |||||
| Expt A |
2 peptides |
3 spectra |
|
0.000 0.000 | 0.087 |
0.328 0.228 | 0.385 |
0.000 0.000 | 0.000 |
0.000 0.000 | 0.024 |
0.091 0.000 | 0.193 |
0.000 0.000 | 0.053 |
0.580 0.467 | 0.653 |
0.000 0.000 | 0.000 |
| 2 spectra, IAVAVVK | 0.000 | 0.306 | 0.000 | 0.000 | 0.093 | 0.000 | 0.601 | 0.000 | ||
| 1 spectrum, QIMSELEILYK | 0.405 | 0.276 | 0.000 | 0.000 | 0.000 | 0.000 | 0.318 | 0.000 |
| Plot | Lyso | Other | |||||||||||
| Expt C |
2 peptides |
7 spectra |
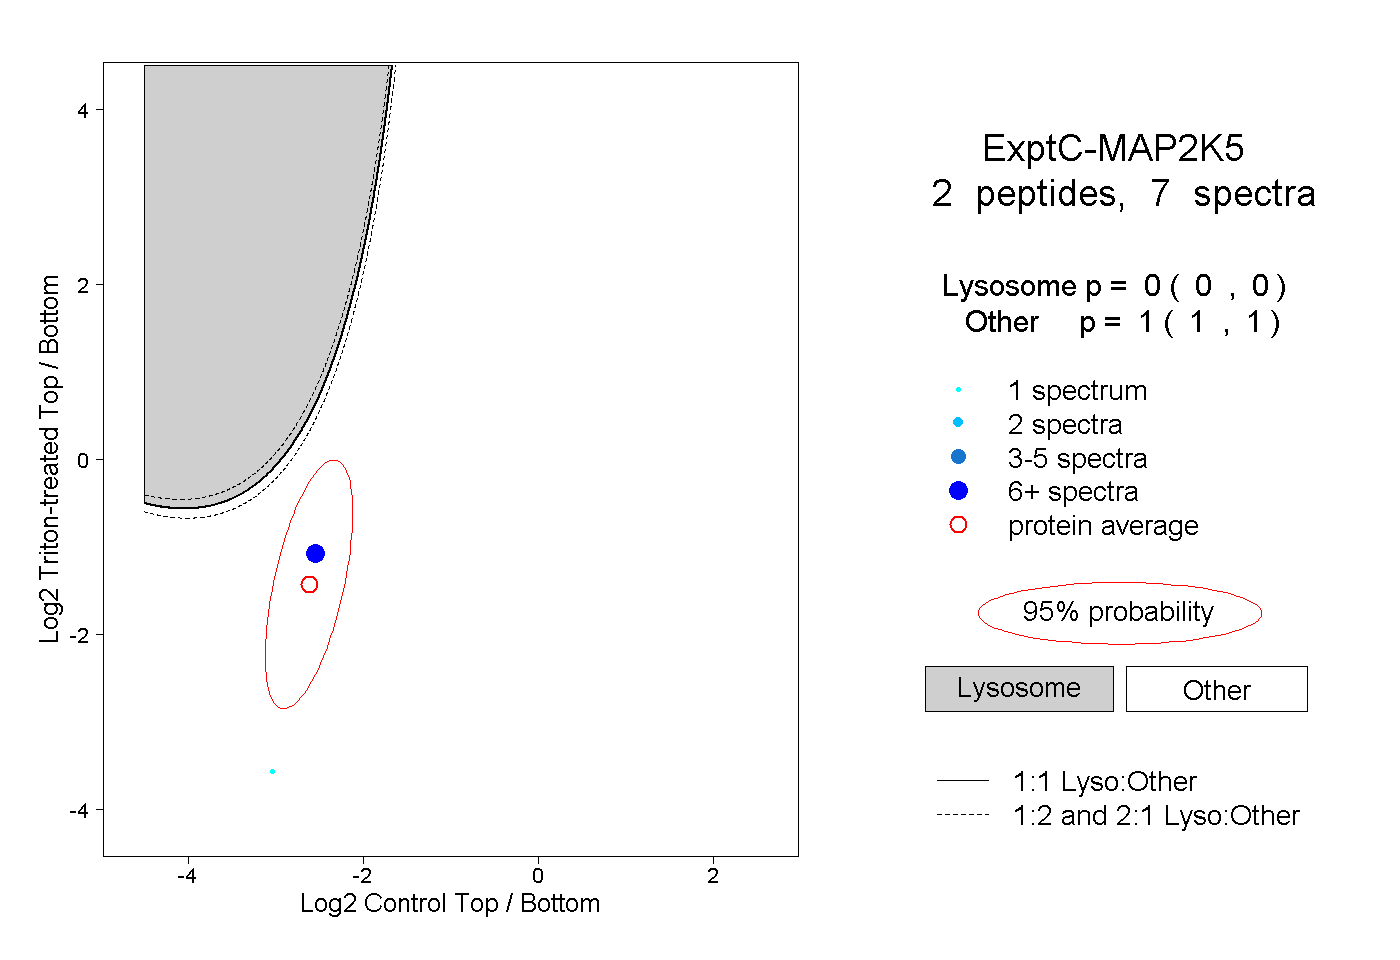 |
0.000 0.000 | 0.000 |
1.000 1.000 | 1.000 |