 26
26peptides
spectra
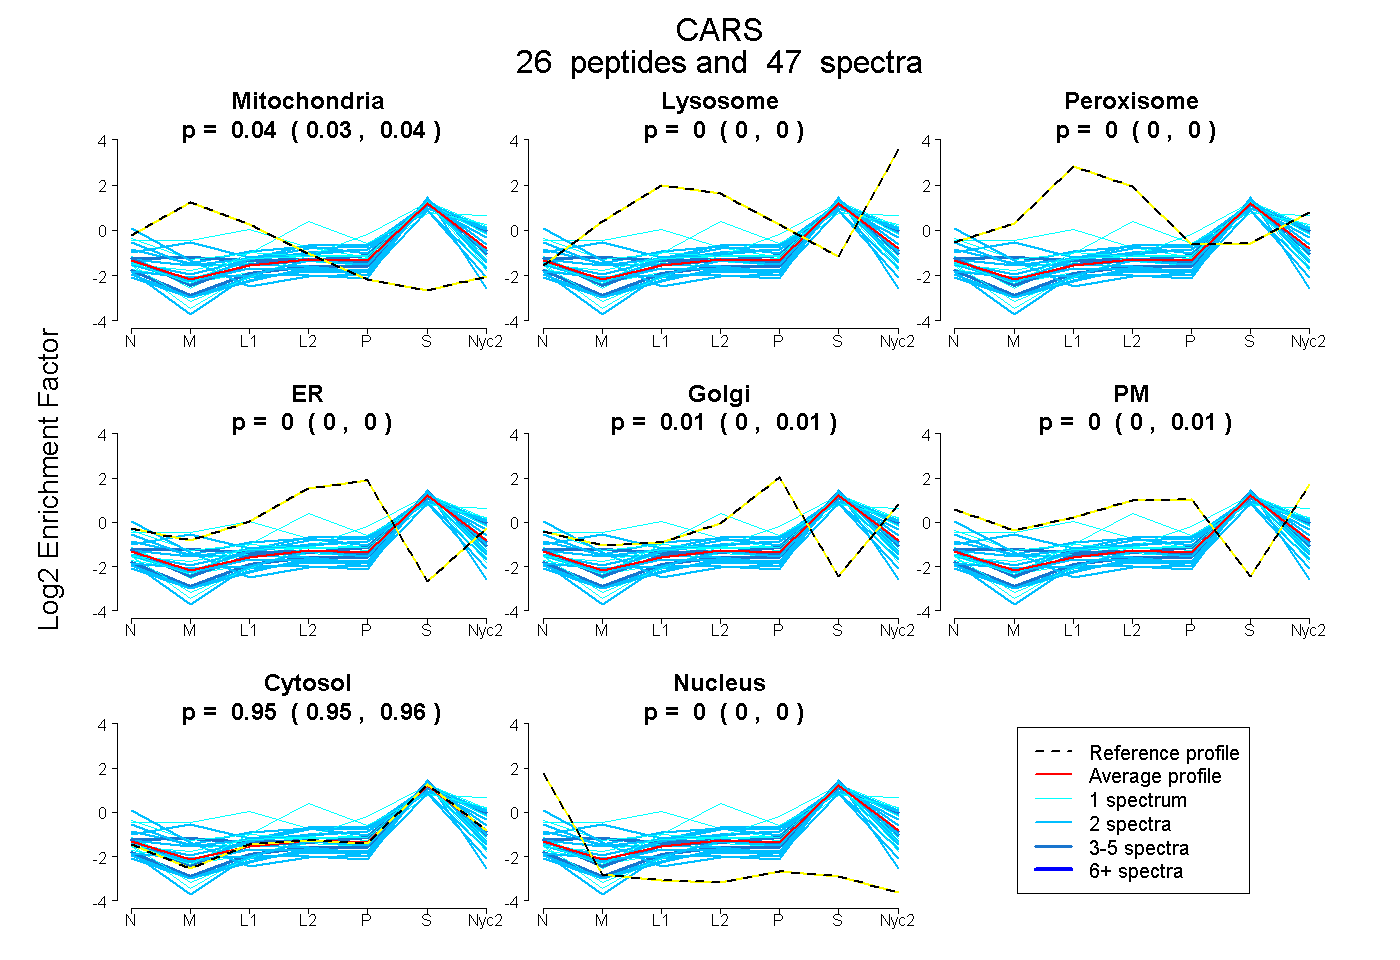
0.031 | 0.044
0.000 | 0.002
0.000 | 0.000
0.000 | 0.000
0.000 | 0.014
0.000 | 0.006
0.947 | 0.957
0.000 | 0.000
4peptides
spectra
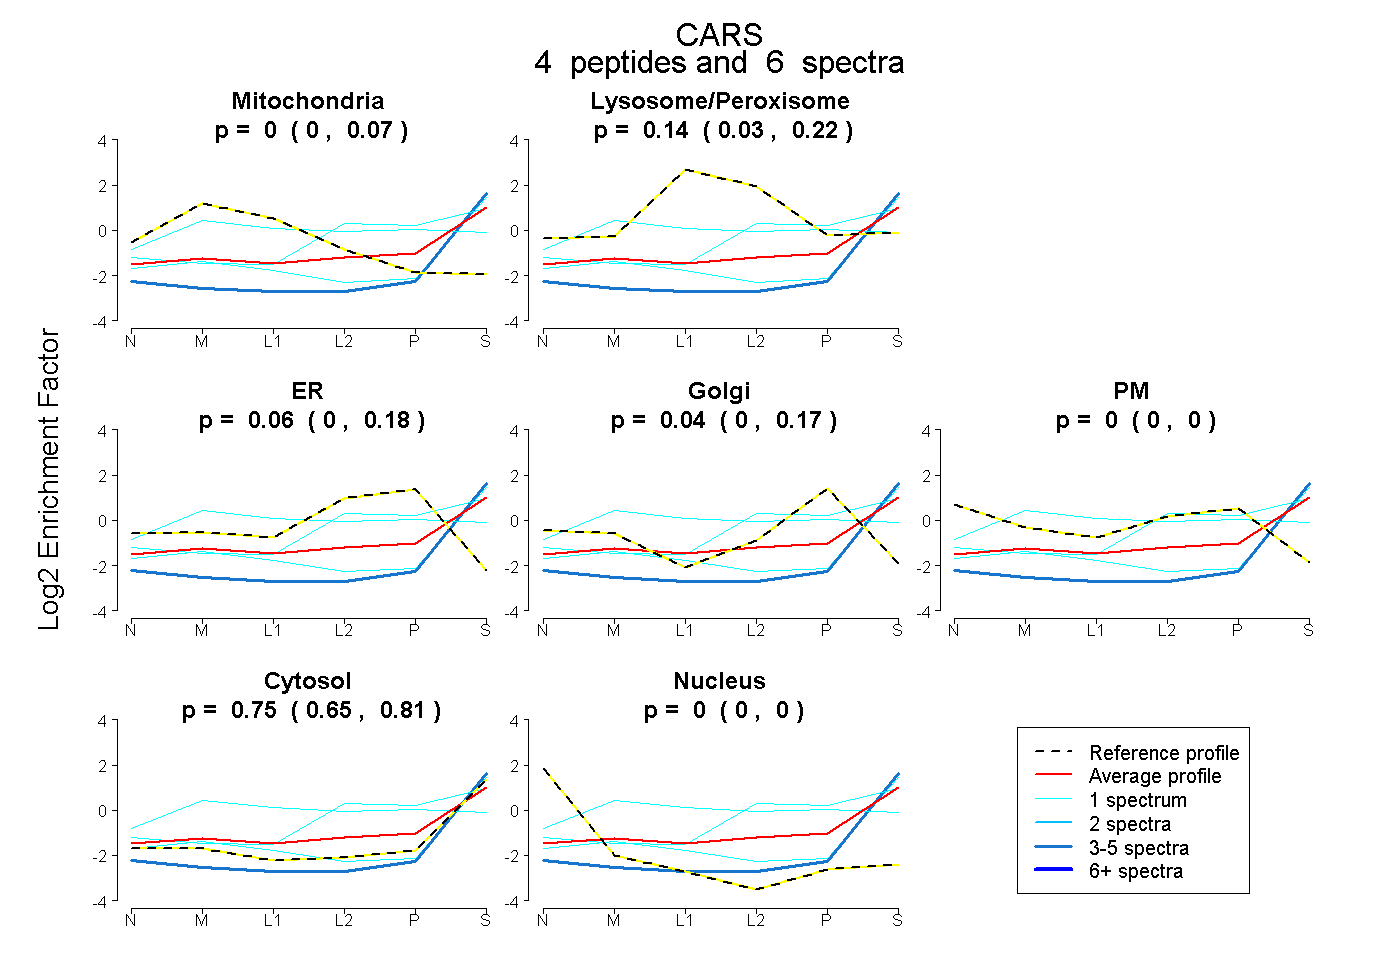
0.000 | 0.073
0.035 | 0.218
0.000 | 0.177
0.000 | 0.165
0.000 | 0.000
0.655 | 0.809
0.000 | 0.000
15peptides
spectra
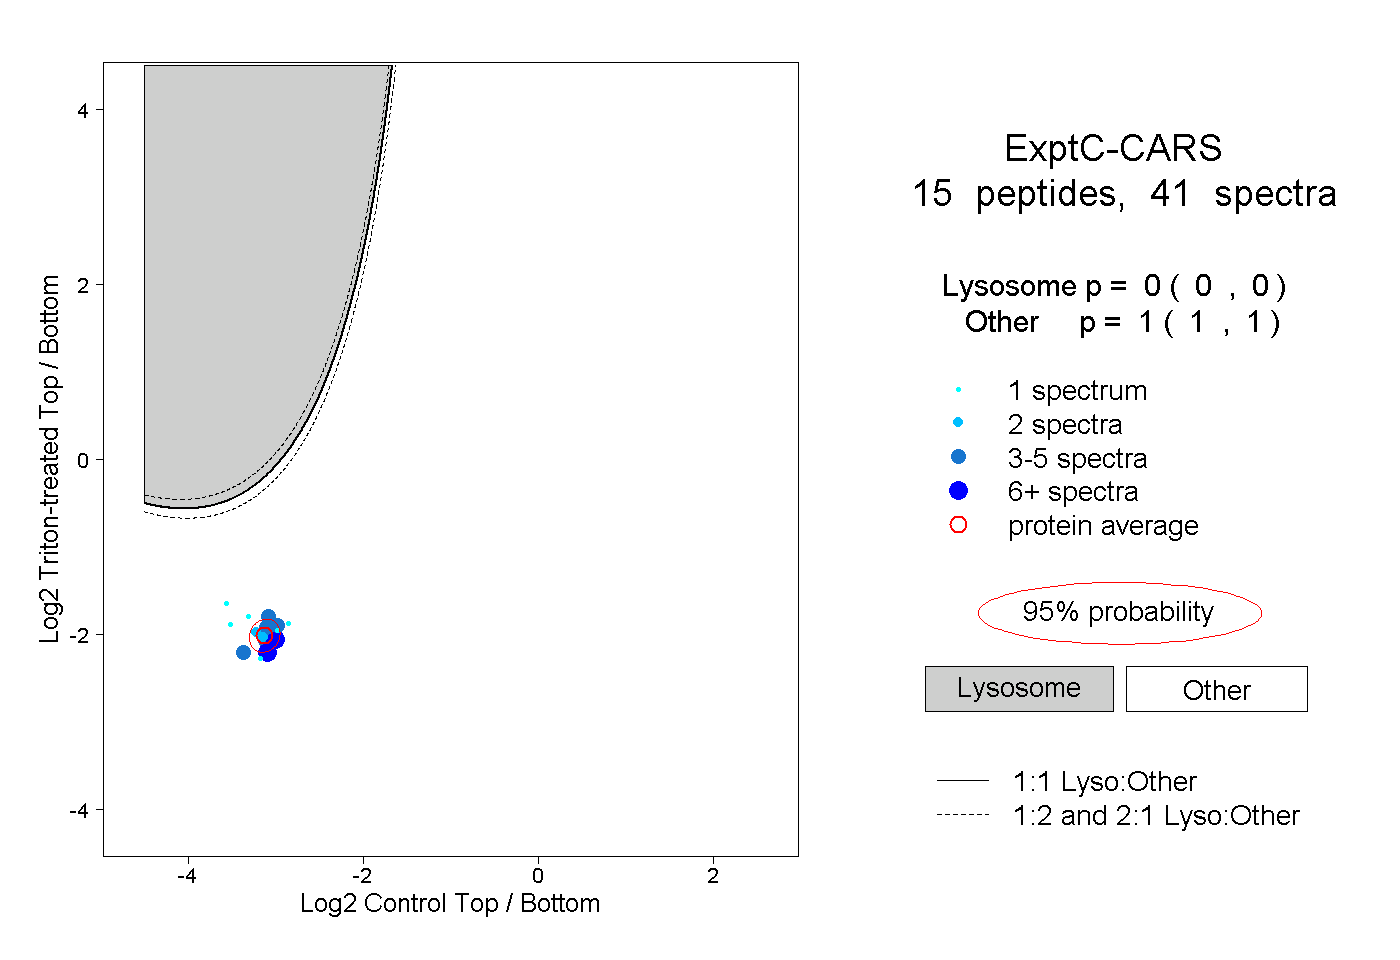
0.000 | 0.000
1.000 | 1.000
1peptide
spectra
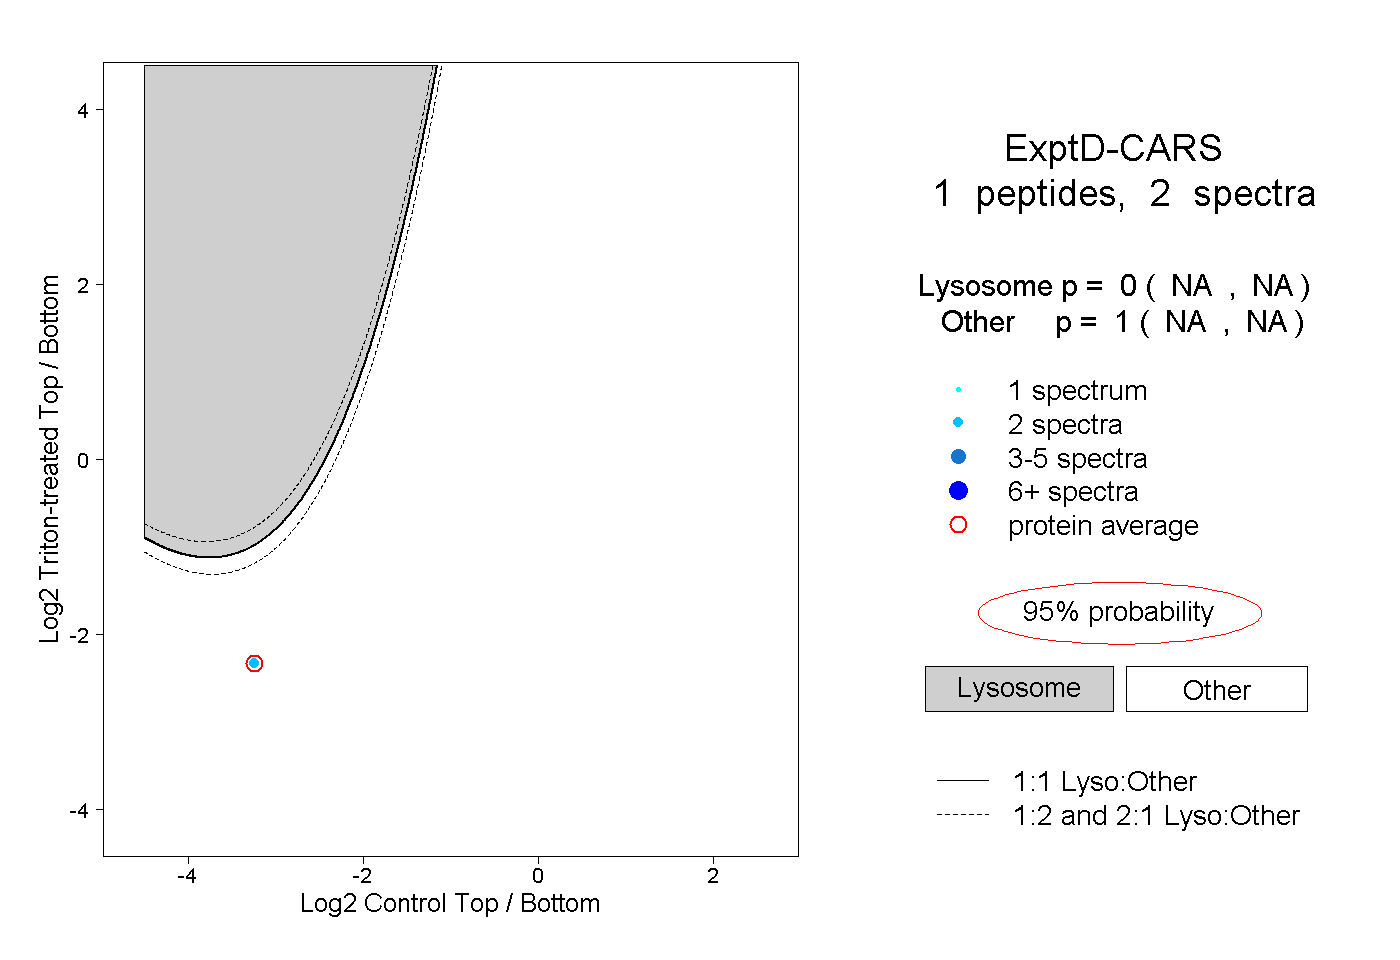
NA | NA
NA | NA