7
7peptides
spectra
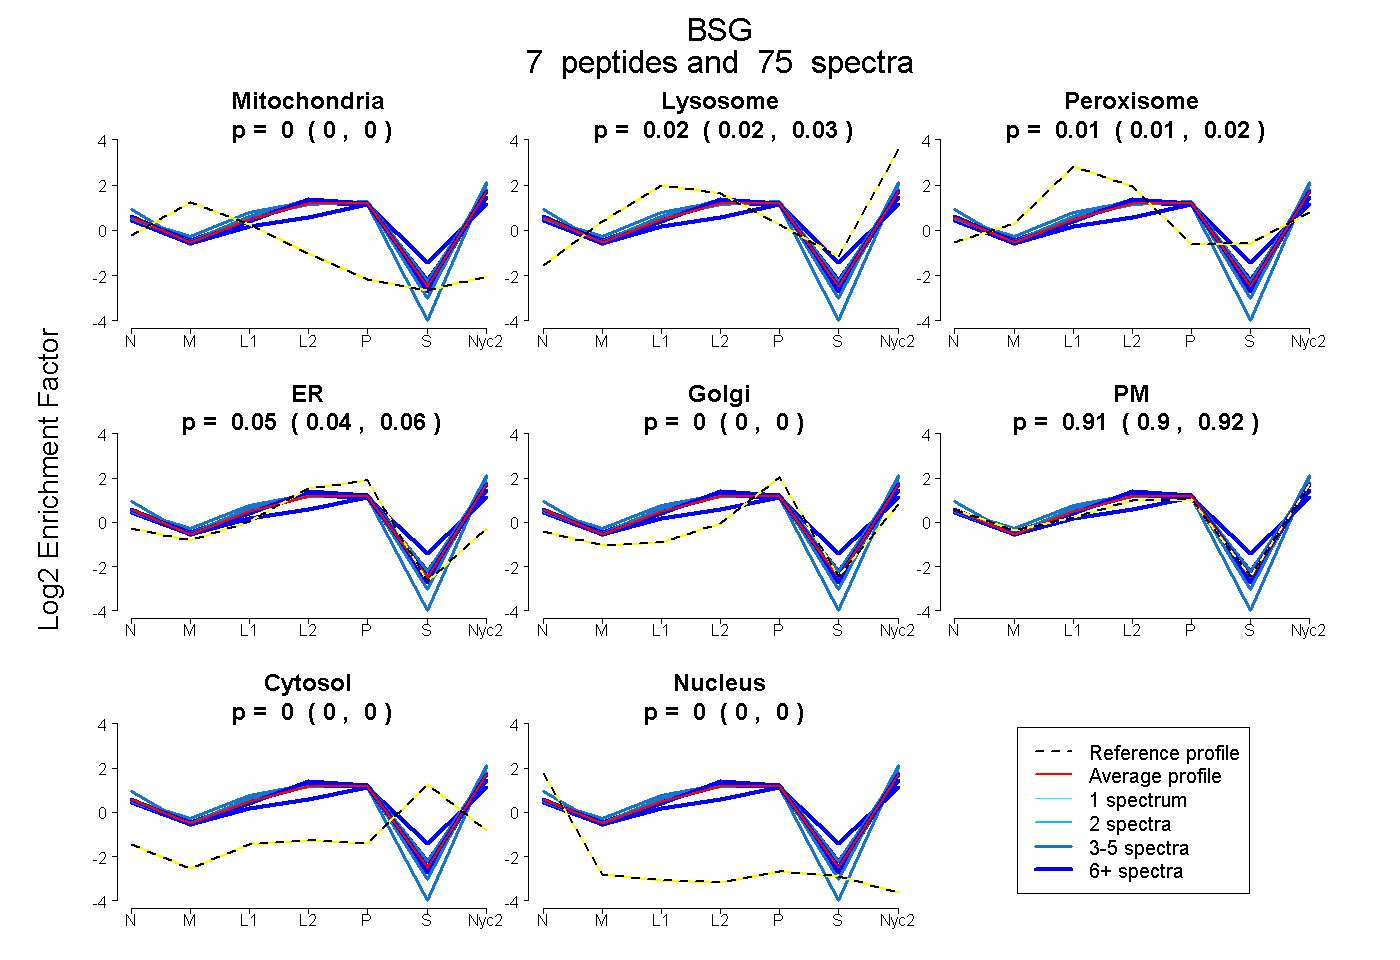
0.000 | 0.000
0.016 | 0.029
0.006 | 0.022
0.044 | 0.058
0.000 | 0.000
0.902 | 0.919
0.000 | 0.000
0.000 | 0.000
6peptides
spectra
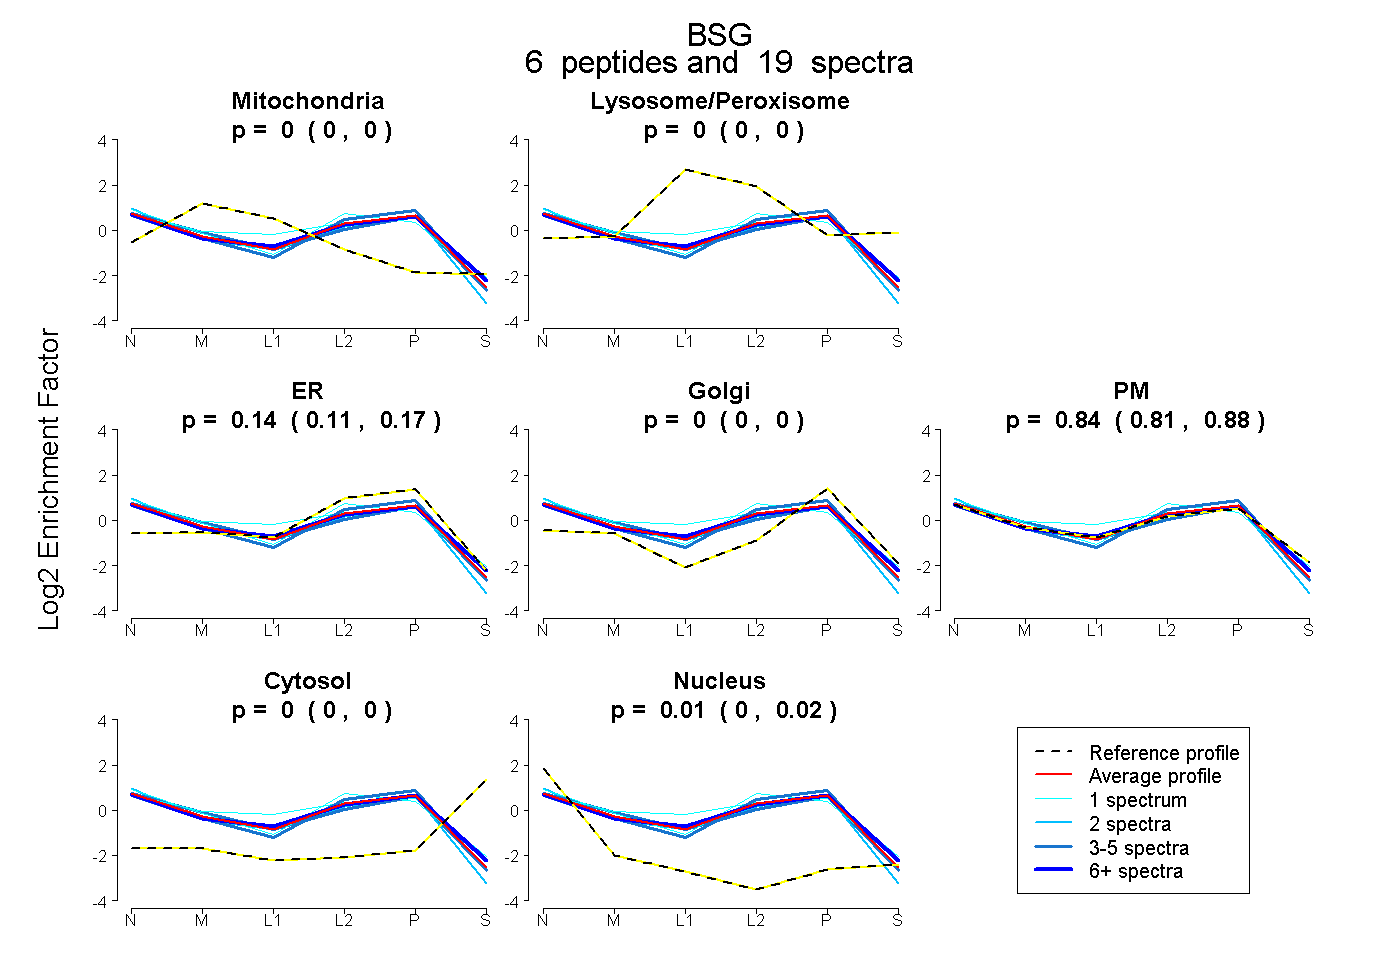
0.000 | 0.000
0.000 | 0.000
0.114 | 0.168
0.000 | 0.000
0.808 | 0.877
0.000 | 0.000
0.002 | 0.021