 2
2peptides
spectra
0.000 | 0.000
0.000 | 0.000
0.000 | 0.000
0.404 | 0.598
0.000 | 0.217
0.000 | 0.000
0.048 | 0.264
0.161 | 0.282
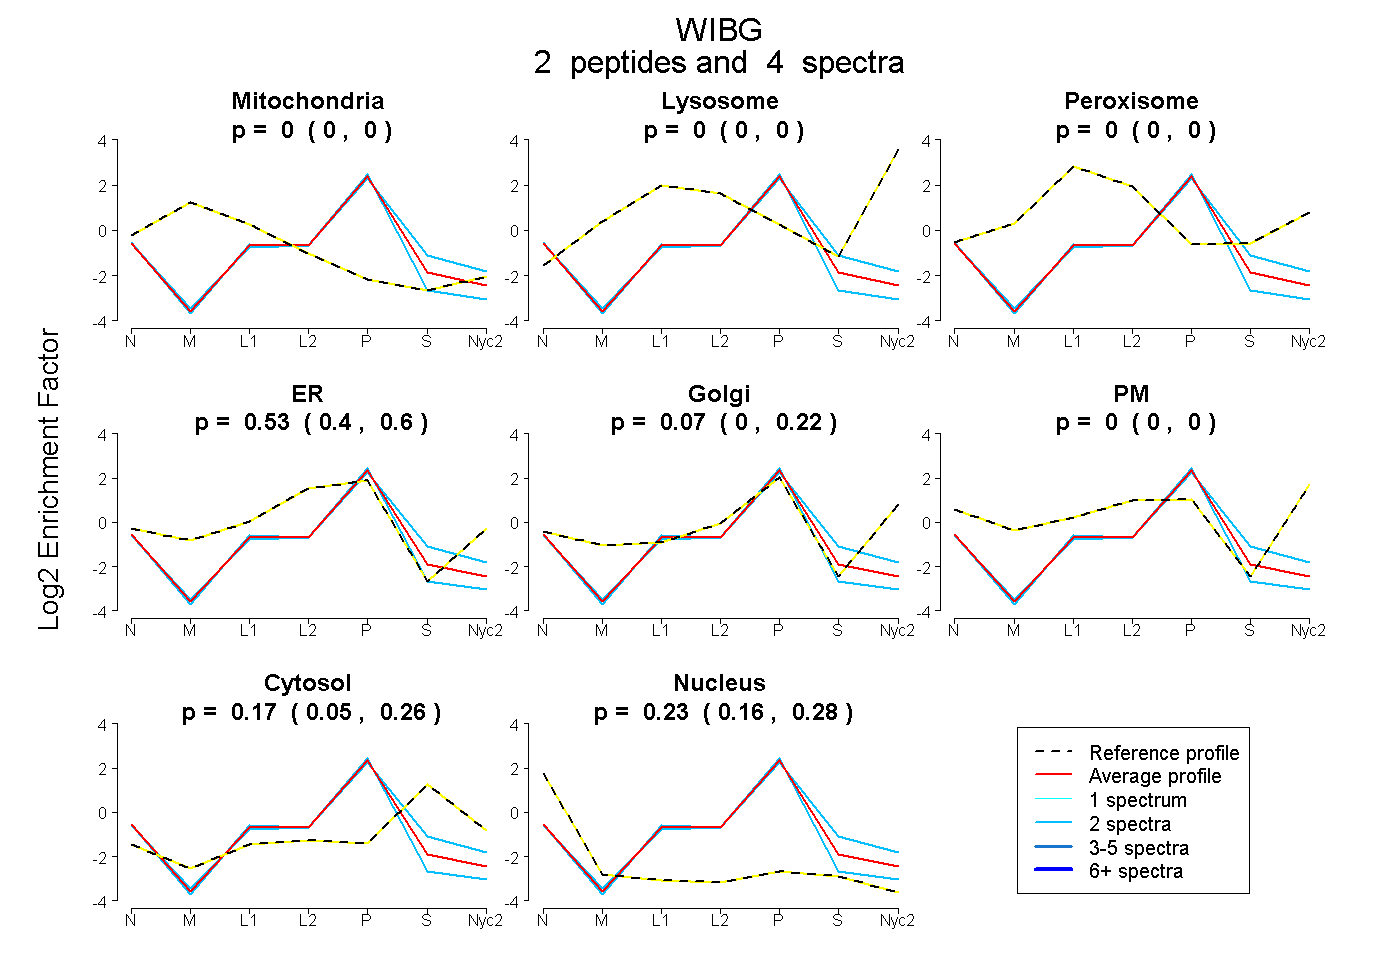
| Plot | Mito | Lyso | Perox | ER | Golgi | PM | Cytosol | Nucleus | |||||
| Expt A |
2 peptides |
4 spectra |
|
0.000 0.000 | 0.000 |
0.000 0.000 | 0.000 |
0.000 0.000 | 0.000 |
0.534 0.404 | 0.598 |
0.072 0.000 | 0.217 |
0.000 0.000 | 0.000 |
0.165 0.048 | 0.264 |
0.229 0.161 | 0.282 |
| 2 spectra, QVEELQQR | 0.000 | 0.000 | 0.000 | 0.651 | 0.000 | 0.000 | 0.014 | 0.335 | ||
| 2 spectra, IQAGEISQPSR | 0.000 | 0.000 | 0.000 | 0.360 | 0.211 | 0.000 | 0.308 | 0.121 |
| Plot | Mito | Lyso or Perox | ER | Golgi | PM | Cytosol | Nucleus | ||||||
| Expt B |
1 peptide |
1 spectrum |
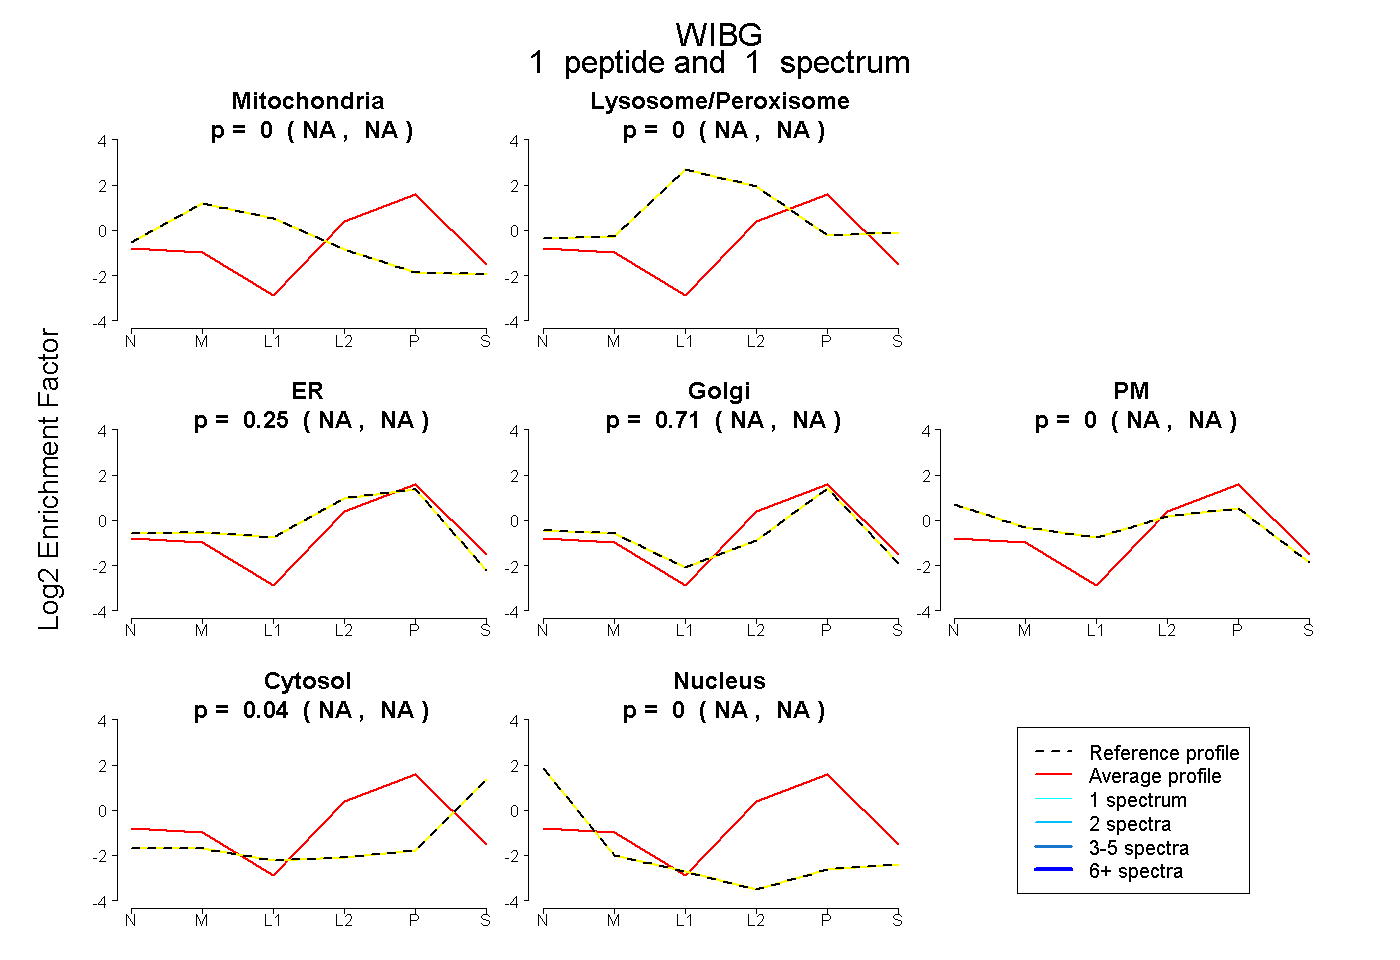 |
0.000 NA | NA |
0.000 NA | NA |
0.249 NA | NA |
0.714 NA | NA |
0.000 NA | NA |
0.038 NA | NA |
0.000 NA | NA |
|||
| Plot | Lyso | Other | |||||||||||
| Expt C |
1 peptide |
3 spectra |
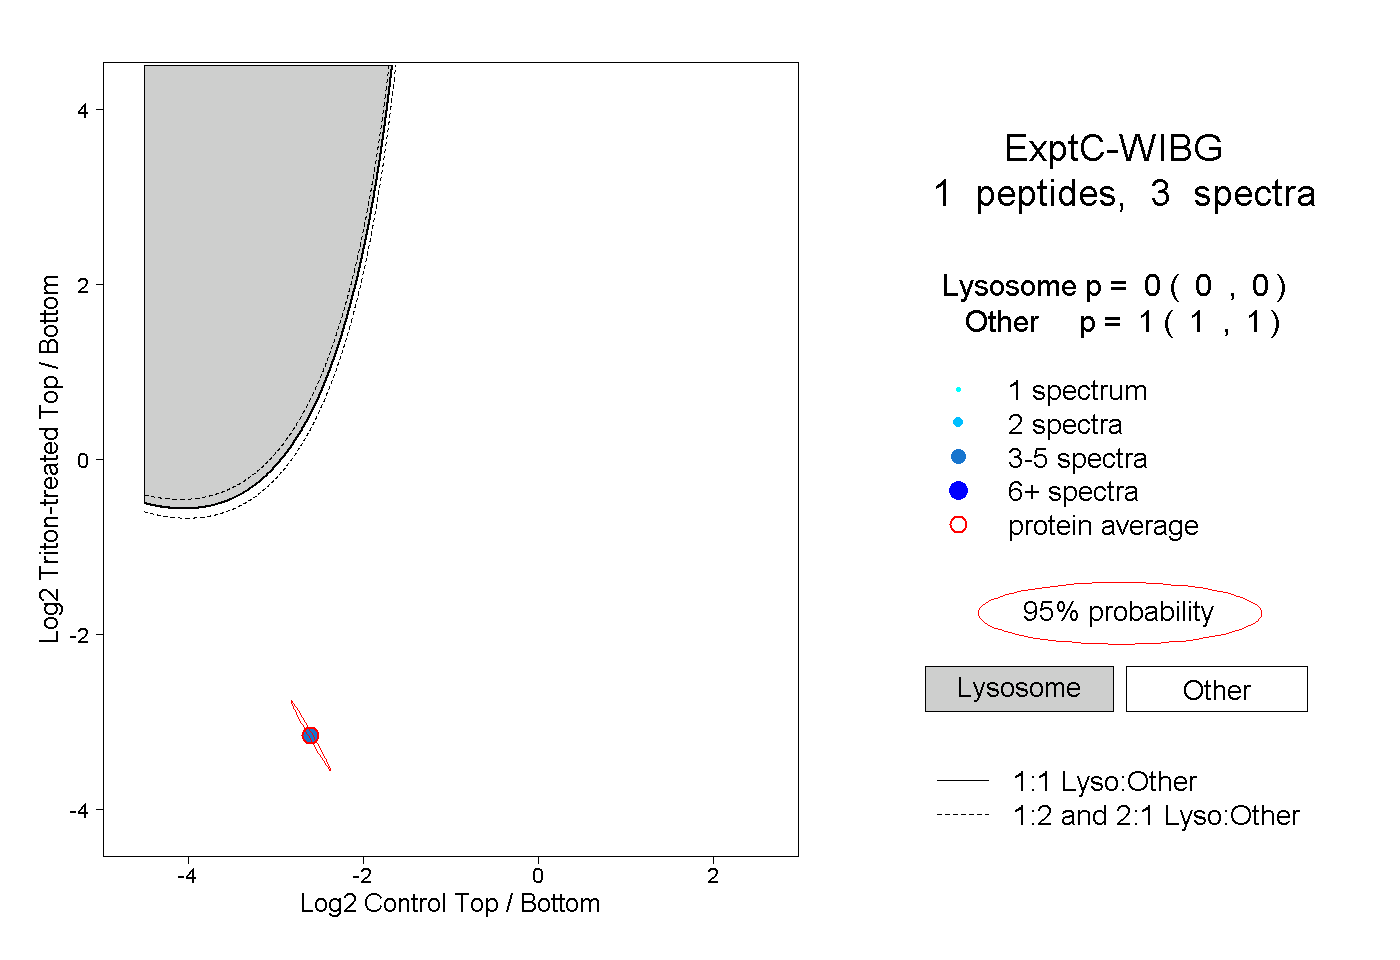 |
0.000 0.000 | 0.000 |
1.000 1.000 | 1.000 |