17
17peptides
spectra
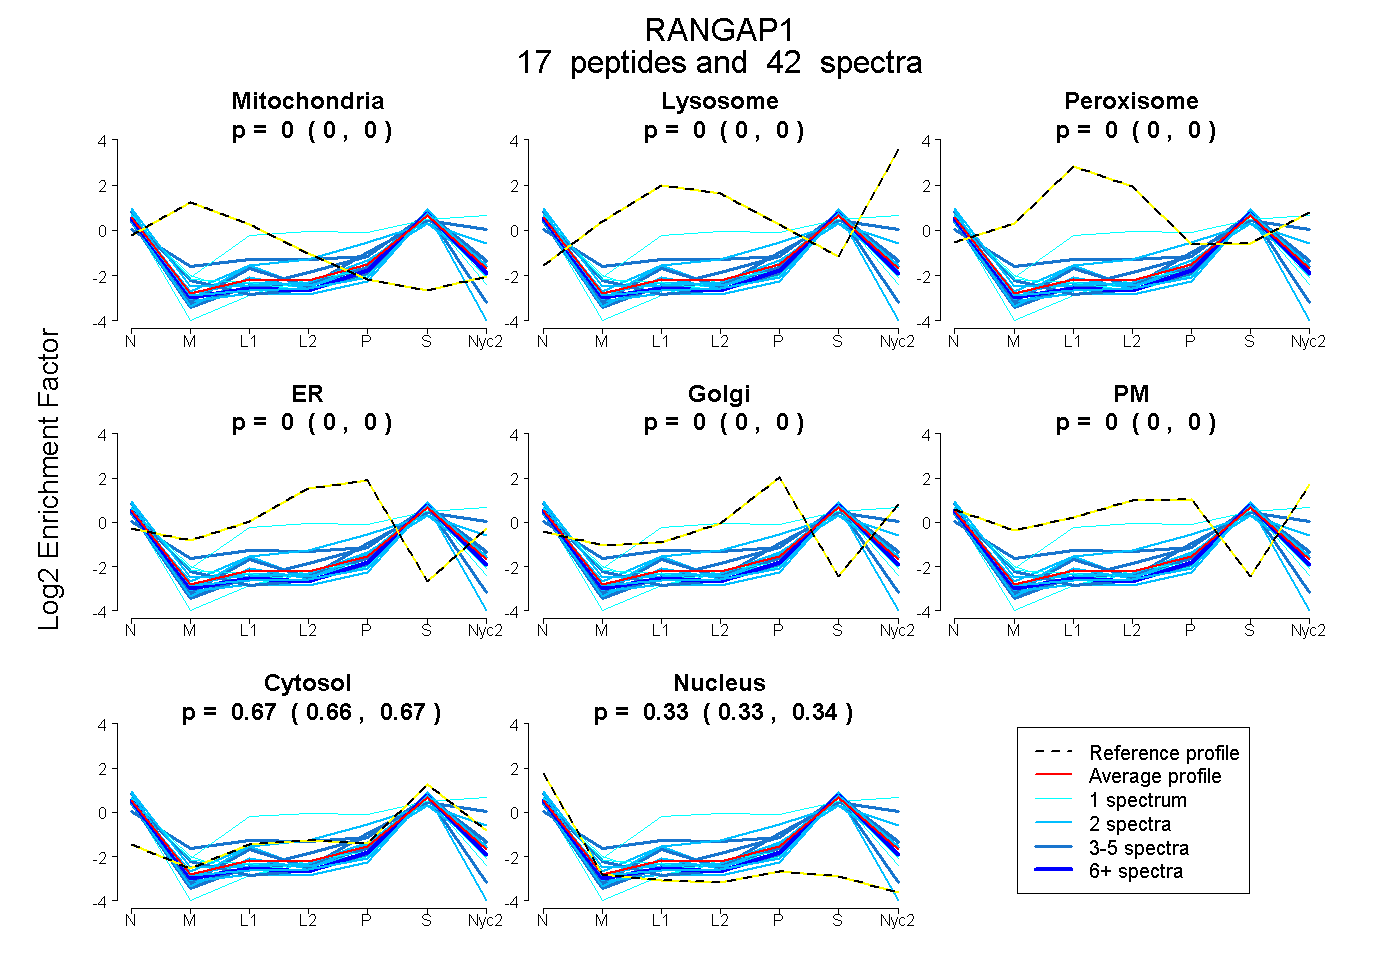
0.000 | 0.000
0.000 | 0.000
0.000 | 0.000
0.000 | 0.000
0.000 | 0.000
0.000 | 0.000
0.662 | 0.674
0.325 | 0.337
7peptides
spectra
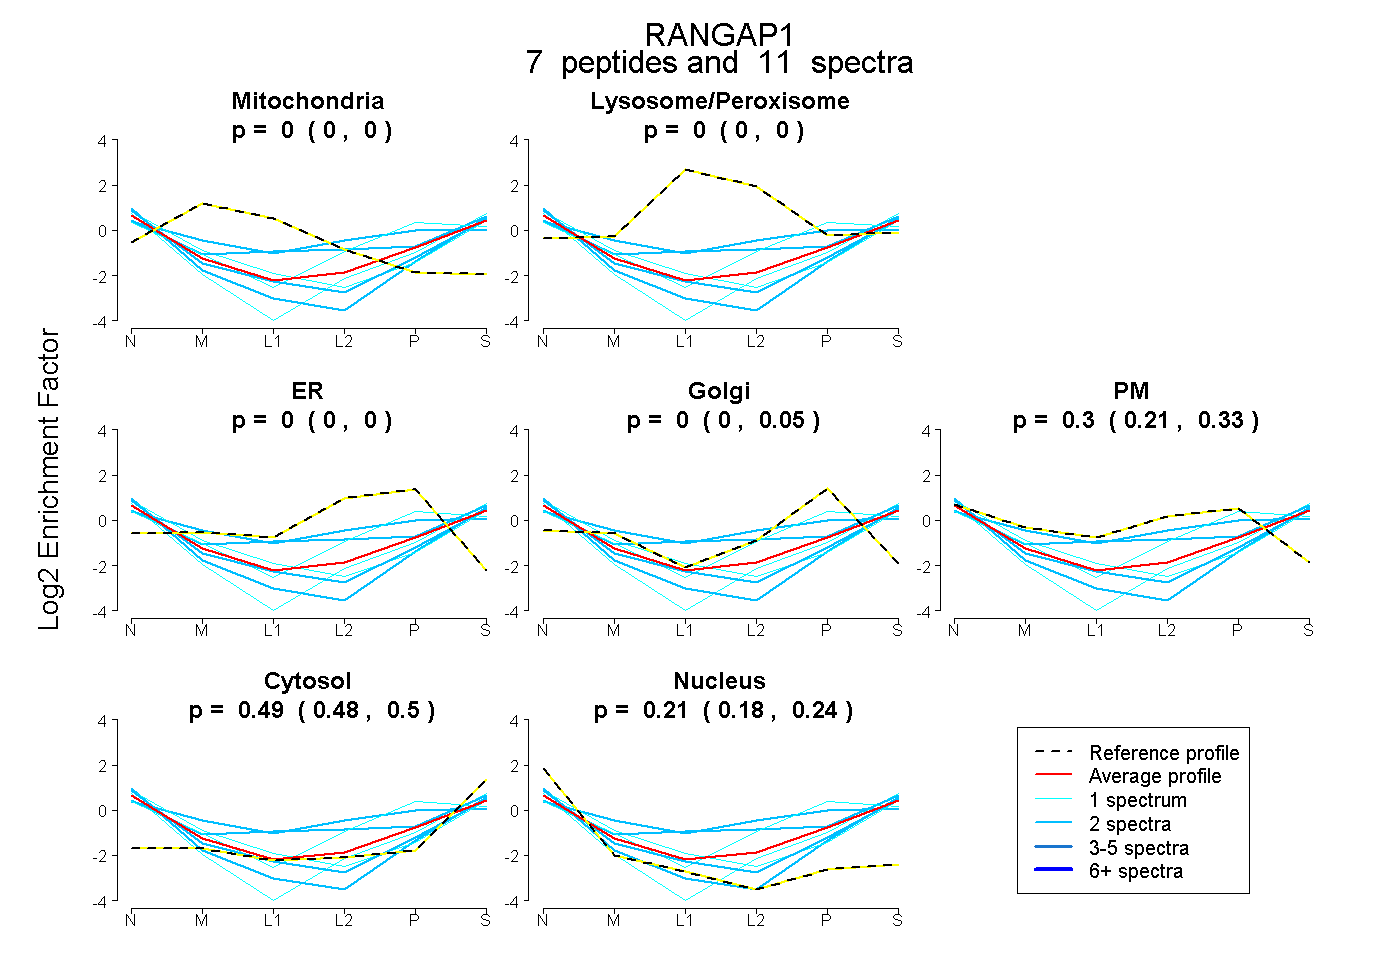
0.000 | 0.000
0.000 | 0.000
0.000 | 0.000
0.000 | 0.049
0.215 | 0.329
0.475 | 0.503
0.181 | 0.243