 7
7peptides
spectra
0.000 | 0.000
0.000 | 0.000
0.000 | 0.000
0.000 | 0.000
0.000 | 0.000
0.684 | 0.699
0.000 | 0.000
0.301 | 0.315
| Plot | Mito | Lyso | Perox | ER | Golgi | PM | Cytosol | Nucleus | |||||
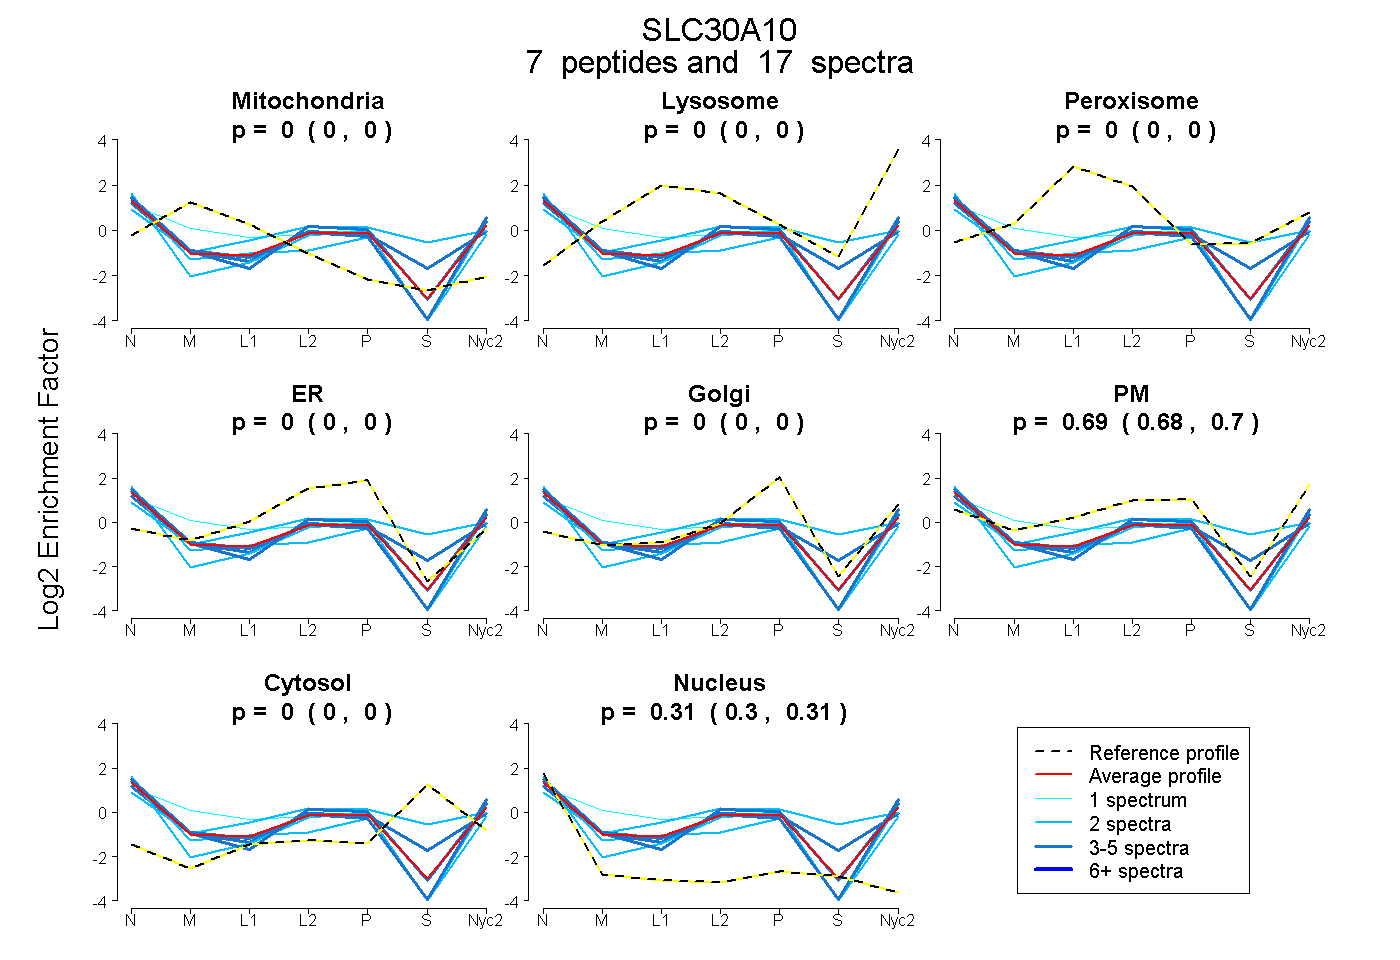
| Expt A |
7 peptides |
17 spectra |
|
0.000 0.000 | 0.000 |
0.000 0.000 | 0.000 |
0.000 0.000 | 0.000 |
0.000 0.000 | 0.000 |
0.000 0.000 | 0.000 |
0.692 0.684 | 0.699 |
0.000 0.000 | 0.000 |
0.308 0.301 | 0.315 |
| 3 spectra, VIATLHIK | 0.000 | 0.000 | 0.000 | 0.000 | 0.000 | 0.704 | 0.000 | 0.296 | ||
| 3 spectra, TRPSQPPR | 0.000 | 0.000 | 0.000 | 0.000 | 0.000 | 0.703 | 0.000 | 0.297 | ||
| 2 spectra, QGQVHSK | 0.000 | 0.000 | 0.117 | 0.000 | 0.000 | 0.490 | 0.280 | 0.114 | ||
| 2 spectra, QGDTGGALGCPR | 0.000 | 0.000 | 0.000 | 0.059 | 0.000 | 0.553 | 0.000 | 0.387 | ||
| 4 spectra, HQEGTEYQDASR | 0.000 | 0.000 | 0.000 | 0.000 | 0.000 | 0.621 | 0.113 | 0.266 | ||
| 1 spectrum, DFLPTCSAPCISQSCAK | 0.194 | 0.000 | 0.000 | 0.000 | 0.000 | 0.671 | 0.000 | 0.135 | ||
| 2 spectra, GSSATYGYVR | 0.000 | 0.000 | 0.000 | 0.000 | 0.000 | 0.638 | 0.000 | 0.362 |
| Plot | Mito | Lyso or Perox | ER | Golgi | PM | Cytosol | Nucleus | ||||||
| Expt B |
1 peptide |
2 spectra |
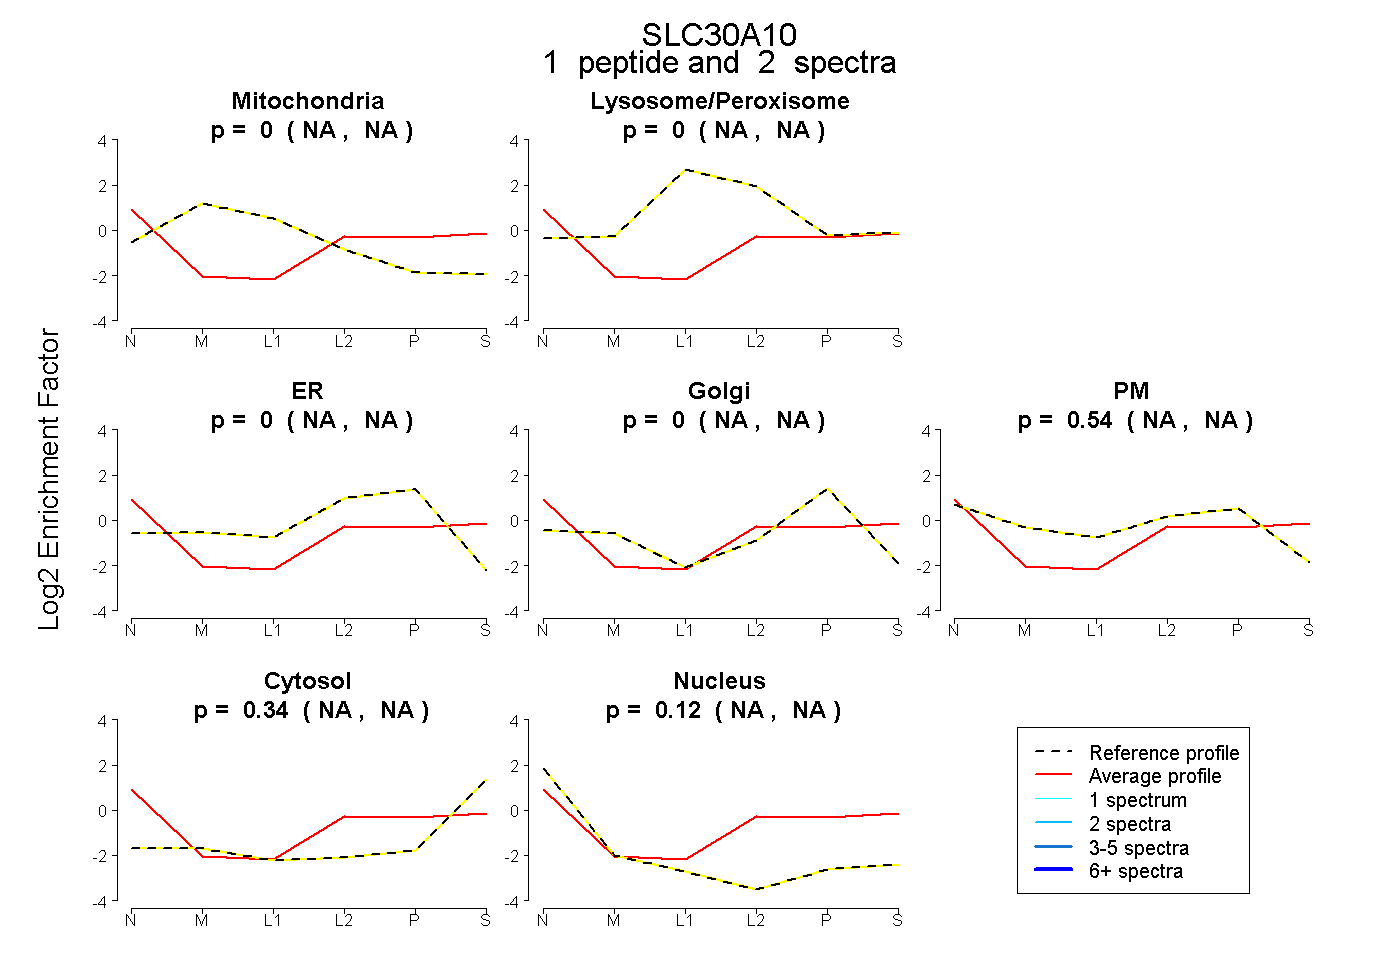 |
0.000 NA | NA |
0.000 NA | NA |
0.000 NA | NA |
0.000 NA | NA |
0.541 NA | NA |
0.341 NA | NA |
0.118 NA | NA |
|||
| Plot | Lyso | Other | |||||||||||
| Expt C |
3 peptides |
7 spectra |
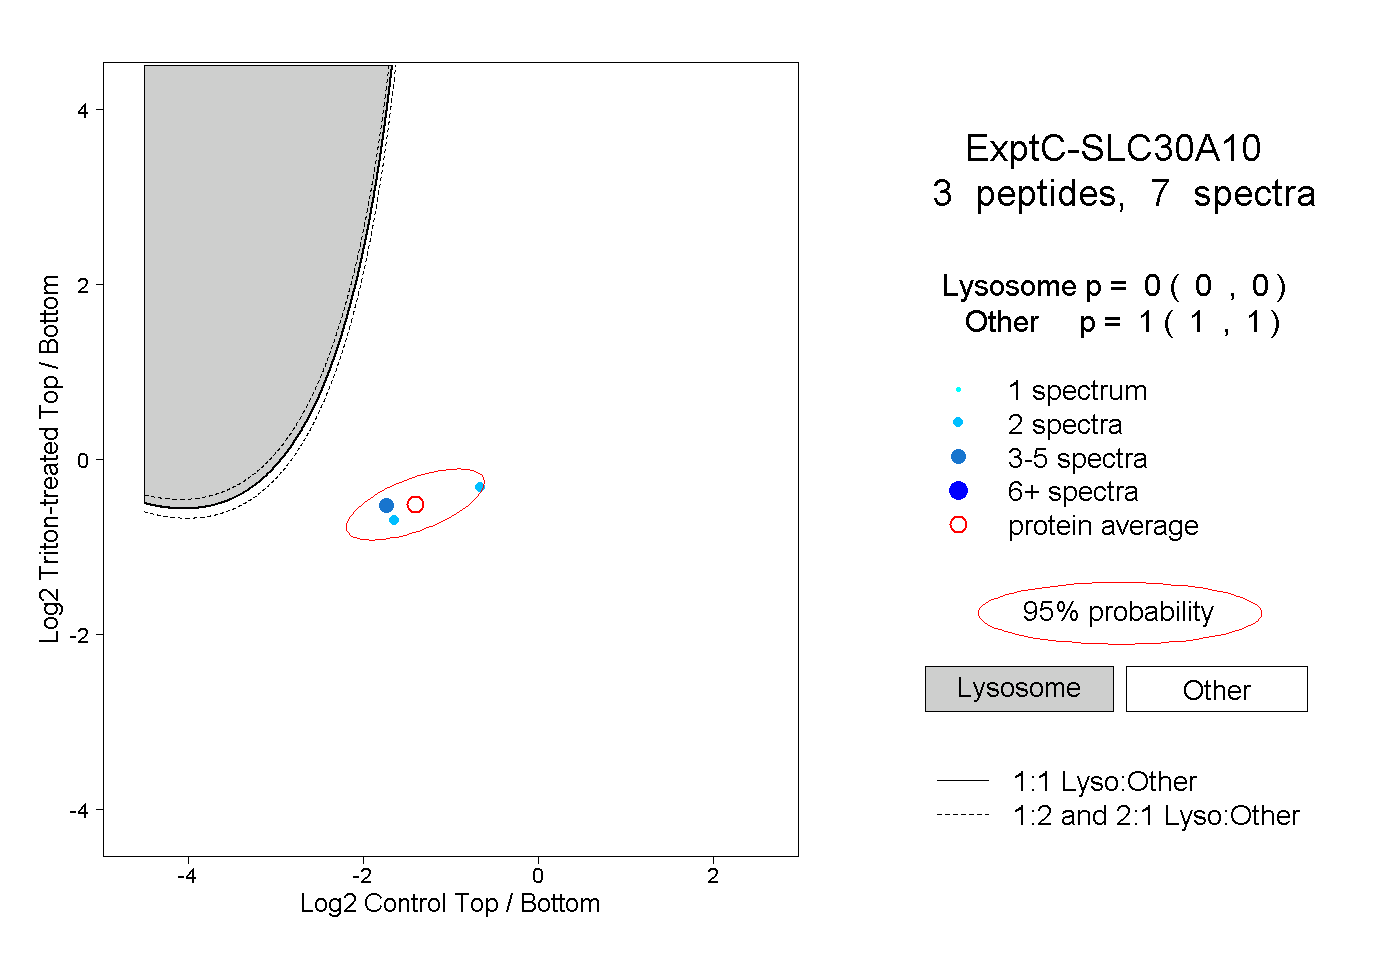 |
0.000 0.000 | 0.000 |
1.000 1.000 | 1.000 |
||||||||
| Plot | Lyso | Other | |||||||||||
| Expt D |
1 peptide |
2 spectra |
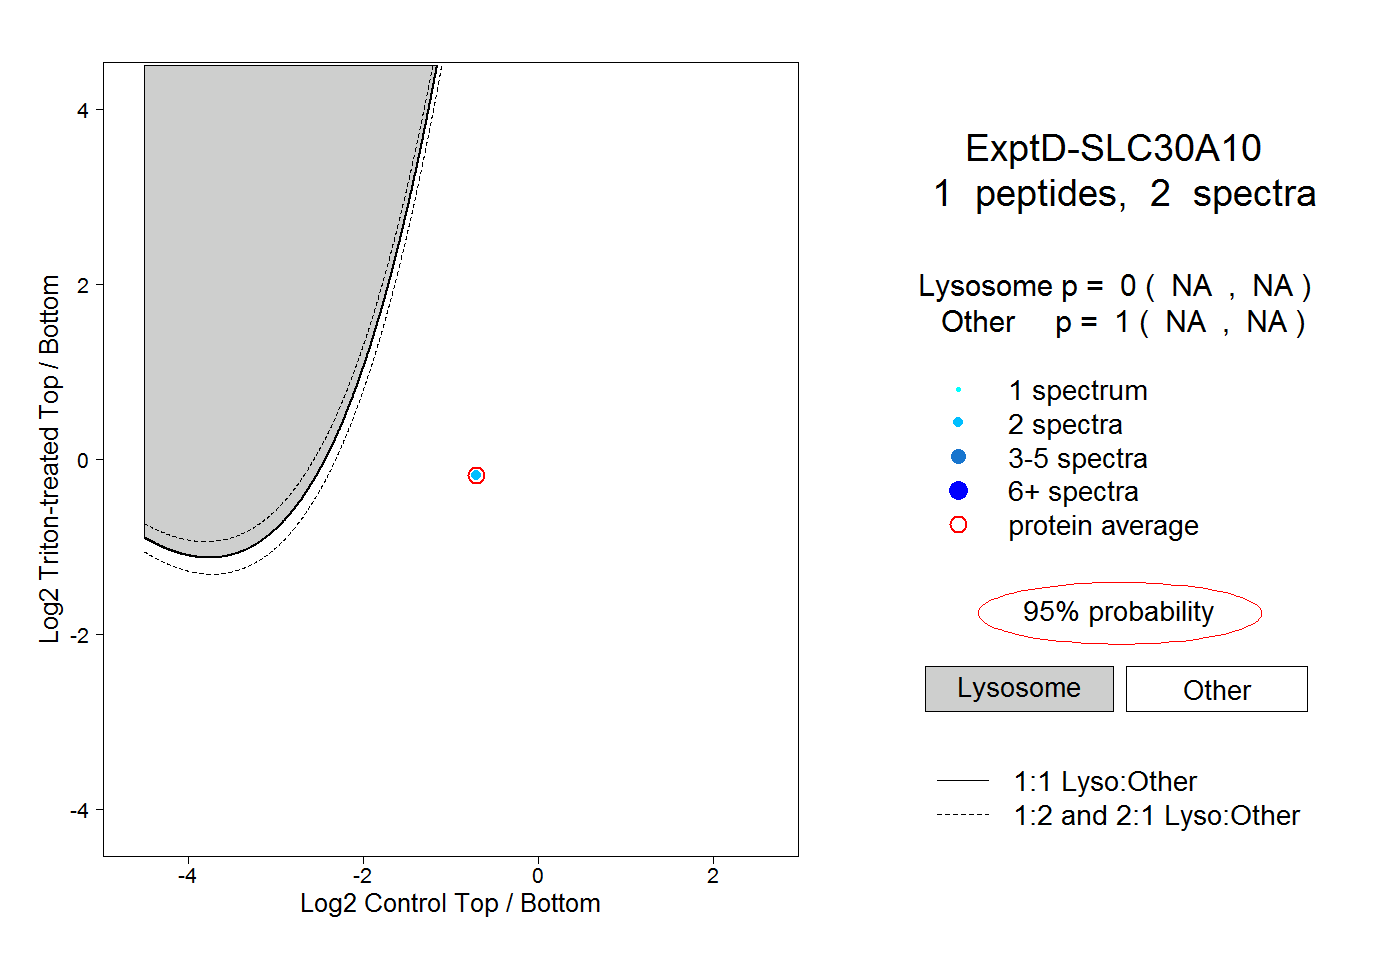 |
0.000 NA | NA |
1.000 NA | NA |