15
15peptides
spectra
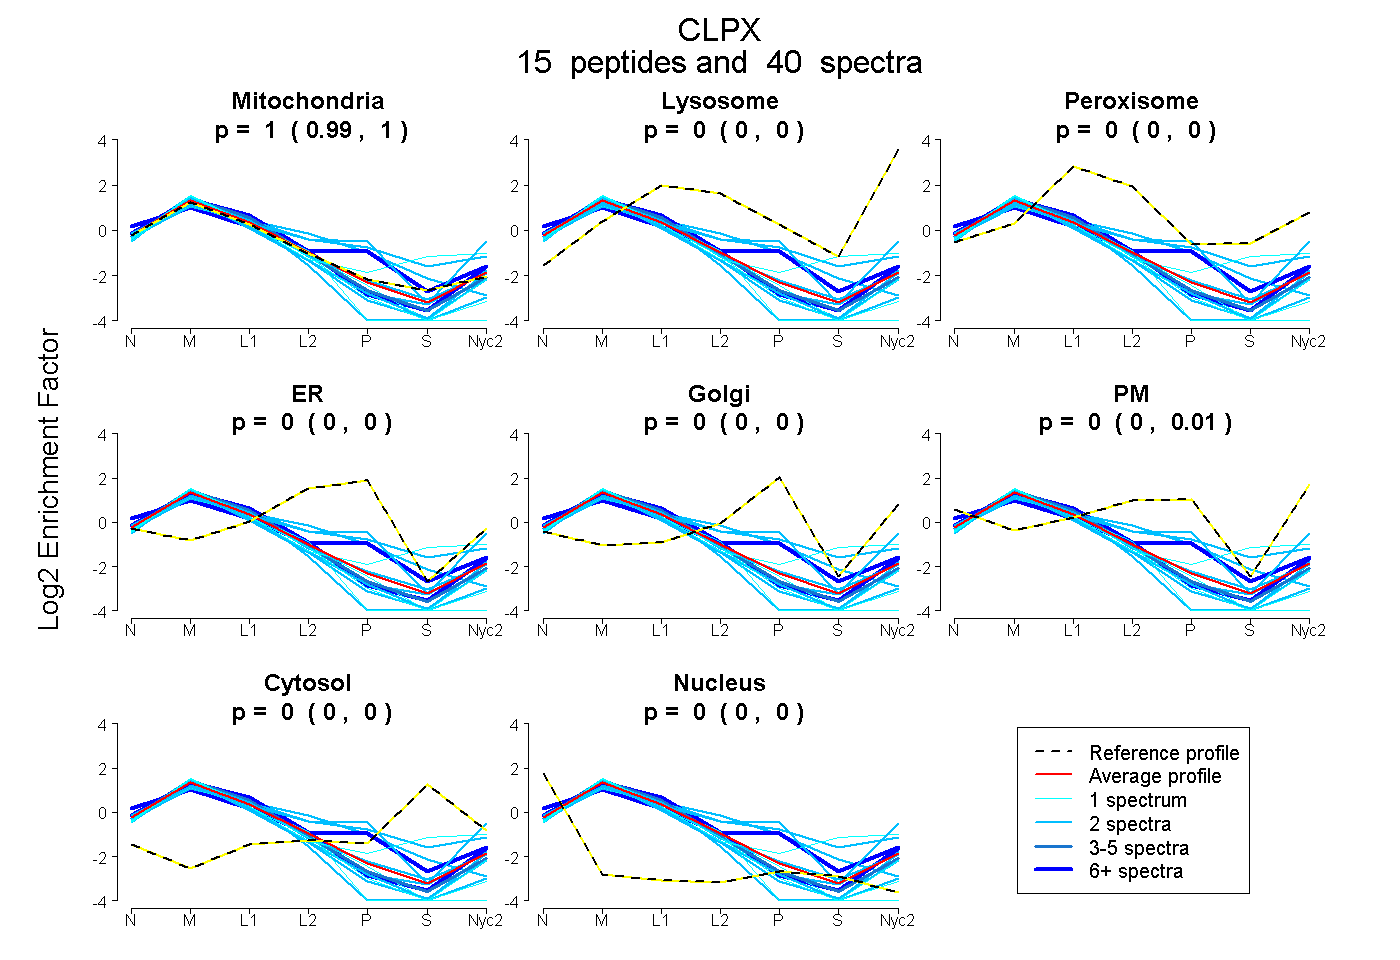
0.986 | 1.000
0.000 | 0.003
0.000 | 0.000
0.000 | 0.000
0.000 | 0.000
0.000 | 0.012
0.000 | 0.000
0.000 | 0.000
12peptides
spectra
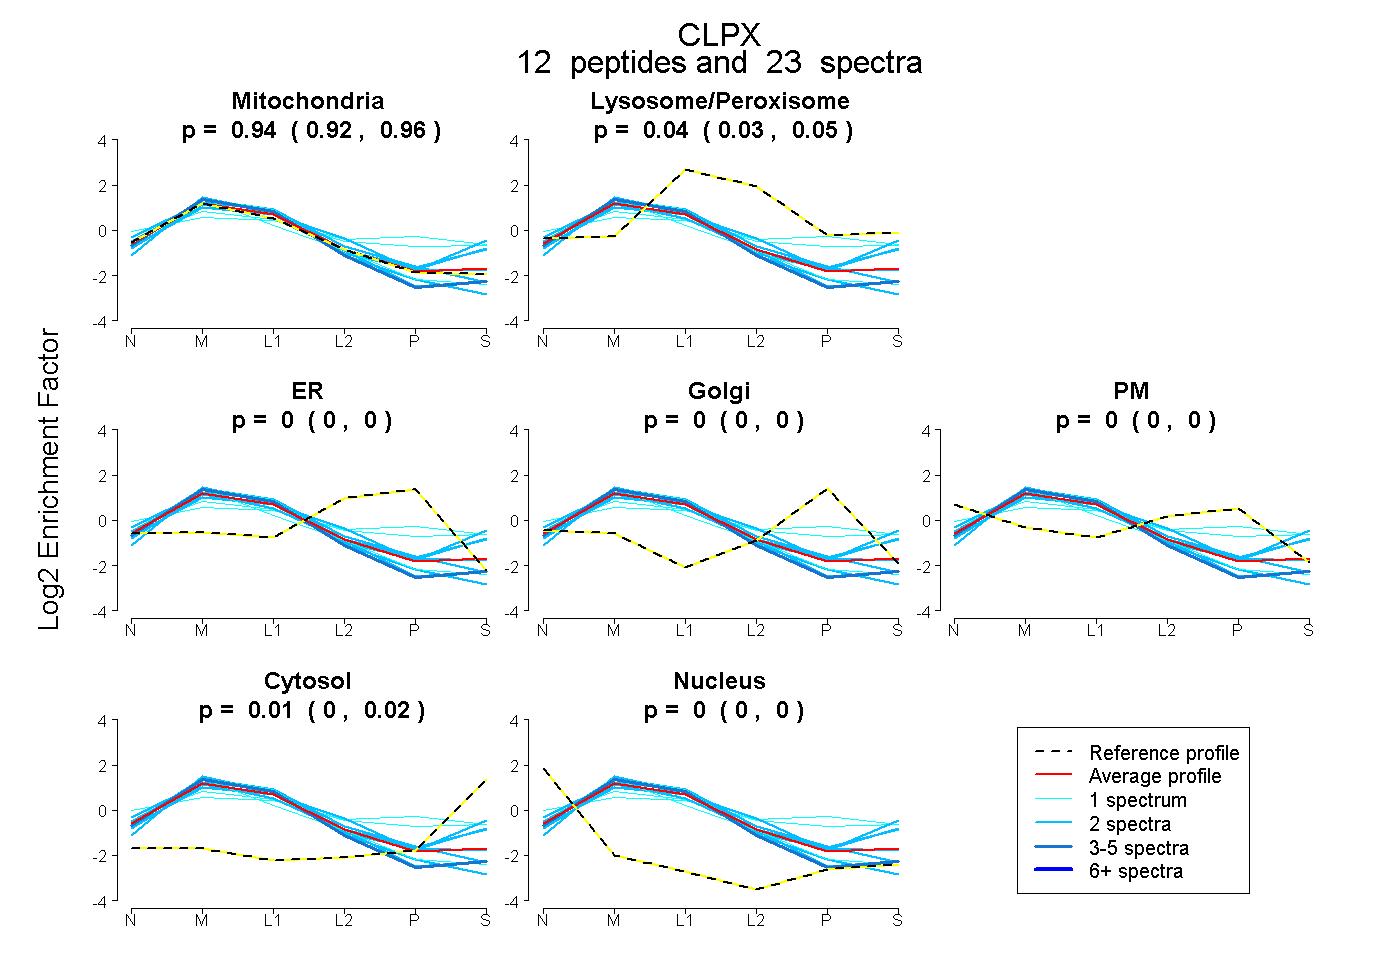
0.923 | 0.962
0.030 | 0.051
0.000 | 0.000
0.000 | 0.000
0.000 | 0.000
0.002 | 0.024
0.000 | 0.000