 15
15peptides
spectra
0.986 | 1.000
0.000 | 0.003
0.000 | 0.000
0.000 | 0.000
0.000 | 0.000
0.000 | 0.012
0.000 | 0.000
0.000 | 0.000
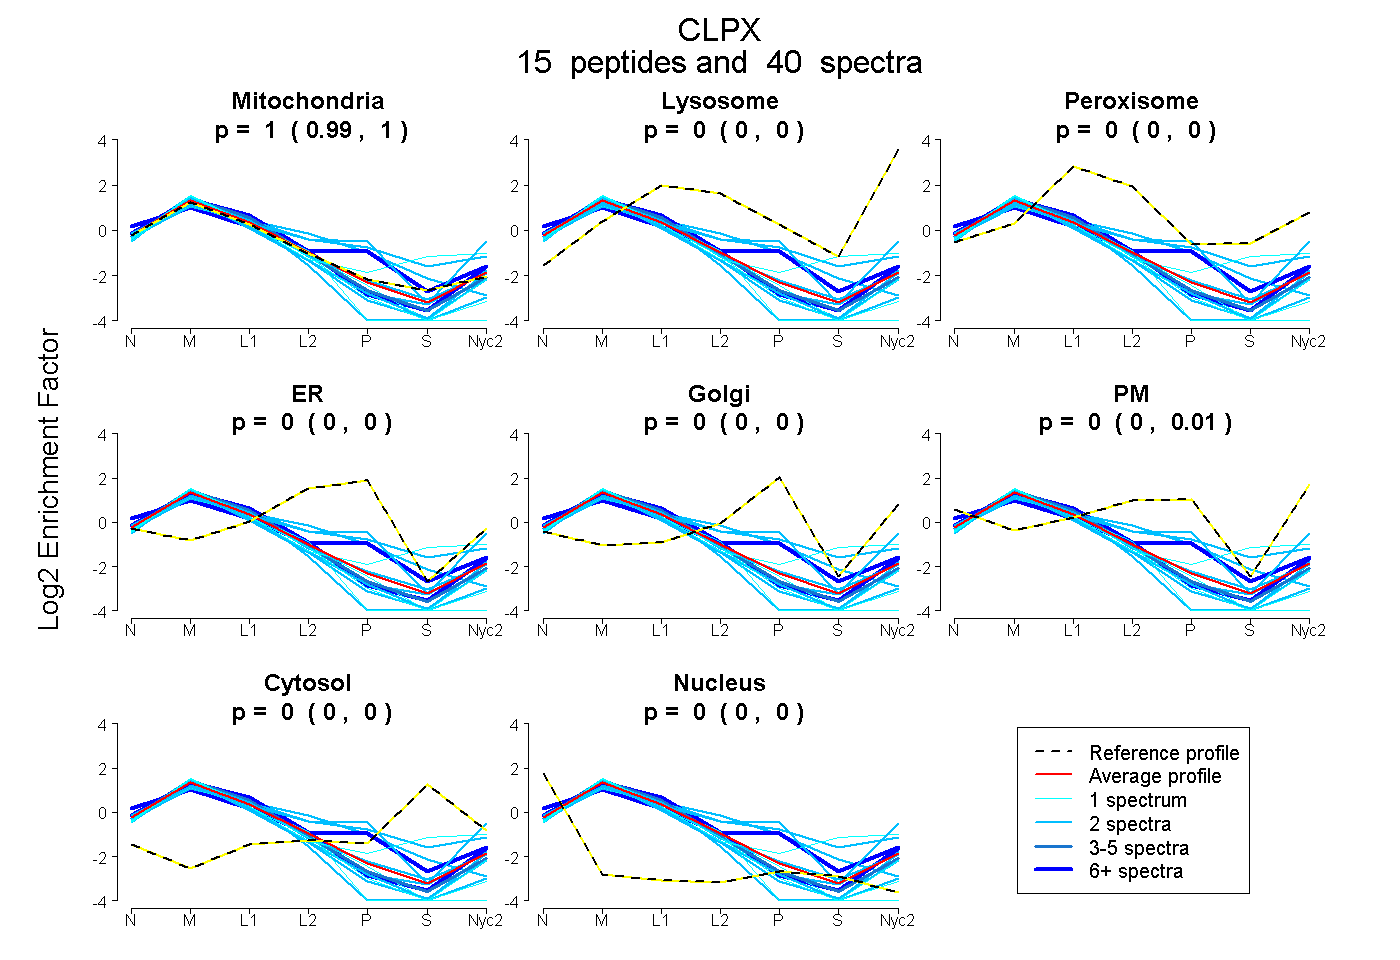
| Plot | Mito | Lyso | Perox | ER | Golgi | PM | Cytosol | Nucleus | |||||
| Expt A |
15 peptides |
40 spectra |
|
0.997 0.986 | 1.000 |
0.000 0.000 | 0.003 |
0.000 0.000 | 0.000 |
0.000 0.000 | 0.000 |
0.000 0.000 | 0.000 |
0.003 0.000 | 0.012 |
0.000 0.000 | 0.000 |
0.000 0.000 | 0.000 |
| 8 spectra, DLIEFGMIPEFVGR | 0.999 | 0.001 | 0.000 | 0.000 | 0.000 | 0.000 | 0.000 | 0.000 | ||
| 4 spectra, LPVVVPLHSLDEK | 1.000 | 0.000 | 0.000 | 0.000 | 0.000 | 0.000 | 0.000 | 0.000 | ||
| 2 spectra, CGDLCTHVETFVSSTR | 0.817 | 0.000 | 0.000 | 0.183 | 0.000 | 0.000 | 0.000 | 0.000 | ||
| 1 spectrum, TLLAQTLAK | 0.936 | 0.000 | 0.000 | 0.000 | 0.000 | 0.000 | 0.000 | 0.064 | ||
| 2 spectra, YLGFGTPSNLGK | 0.598 | 0.000 | 0.000 | 0.003 | 0.054 | 0.345 | 0.000 | 0.000 | ||
| 2 spectra, SNILLLGPTGSGK | 1.000 | 0.000 | 0.000 | 0.000 | 0.000 | 0.000 | 0.000 | 0.000 | ||
| 8 spectra, IGSVPGIHQLR | 0.773 | 0.000 | 0.000 | 0.045 | 0.147 | 0.030 | 0.000 | 0.004 | ||
| 1 spectrum, LAFQQKPPPPPK | 0.985 | 0.000 | 0.000 | 0.000 | 0.000 | 0.000 | 0.000 | 0.015 | ||
| 2 spectra, AAAAADLANR | 1.000 | 0.000 | 0.000 | 0.000 | 0.000 | 0.000 | 0.000 | 0.000 | ||
| 1 spectrum, VLSVAVYNHYK | 0.720 | 0.098 | 0.008 | 0.000 | 0.000 | 0.000 | 0.175 | 0.000 | ||
| 2 spectra, AQQGIVFLDEVDK | 0.942 | 0.000 | 0.000 | 0.000 | 0.000 | 0.000 | 0.000 | 0.058 | ||
| 2 spectra, IYNYLDK | 1.000 | 0.000 | 0.000 | 0.000 | 0.000 | 0.000 | 0.000 | 0.000 | ||
| 2 spectra, IYNNIPANLR | 0.603 | 0.000 | 0.196 | 0.000 | 0.160 | 0.000 | 0.041 | 0.000 | ||
| 2 spectra, QTSLTPR | 0.967 | 0.000 | 0.000 | 0.000 | 0.000 | 0.000 | 0.000 | 0.033 | ||
| 1 spectrum, TLVQILTEPR | 1.000 | 0.000 | 0.000 | 0.000 | 0.000 | 0.000 | 0.000 | 0.000 |
| Plot | Mito | Lyso or Perox | ER | Golgi | PM | Cytosol | Nucleus | ||||||
| Expt B |
12 peptides |
23 spectra |
 |
0.945 0.923 | 0.962 |
0.042 0.030 | 0.051 |
0.000 0.000 | 0.000 |
0.000 0.000 | 0.000 |
0.000 0.000 | 0.000 |
0.014 0.002 | 0.024 |
0.000 0.000 | 0.000 |
|||
| Plot | Lyso | Other | |||||||||||
| Expt C |
23 peptides |
198 spectra |
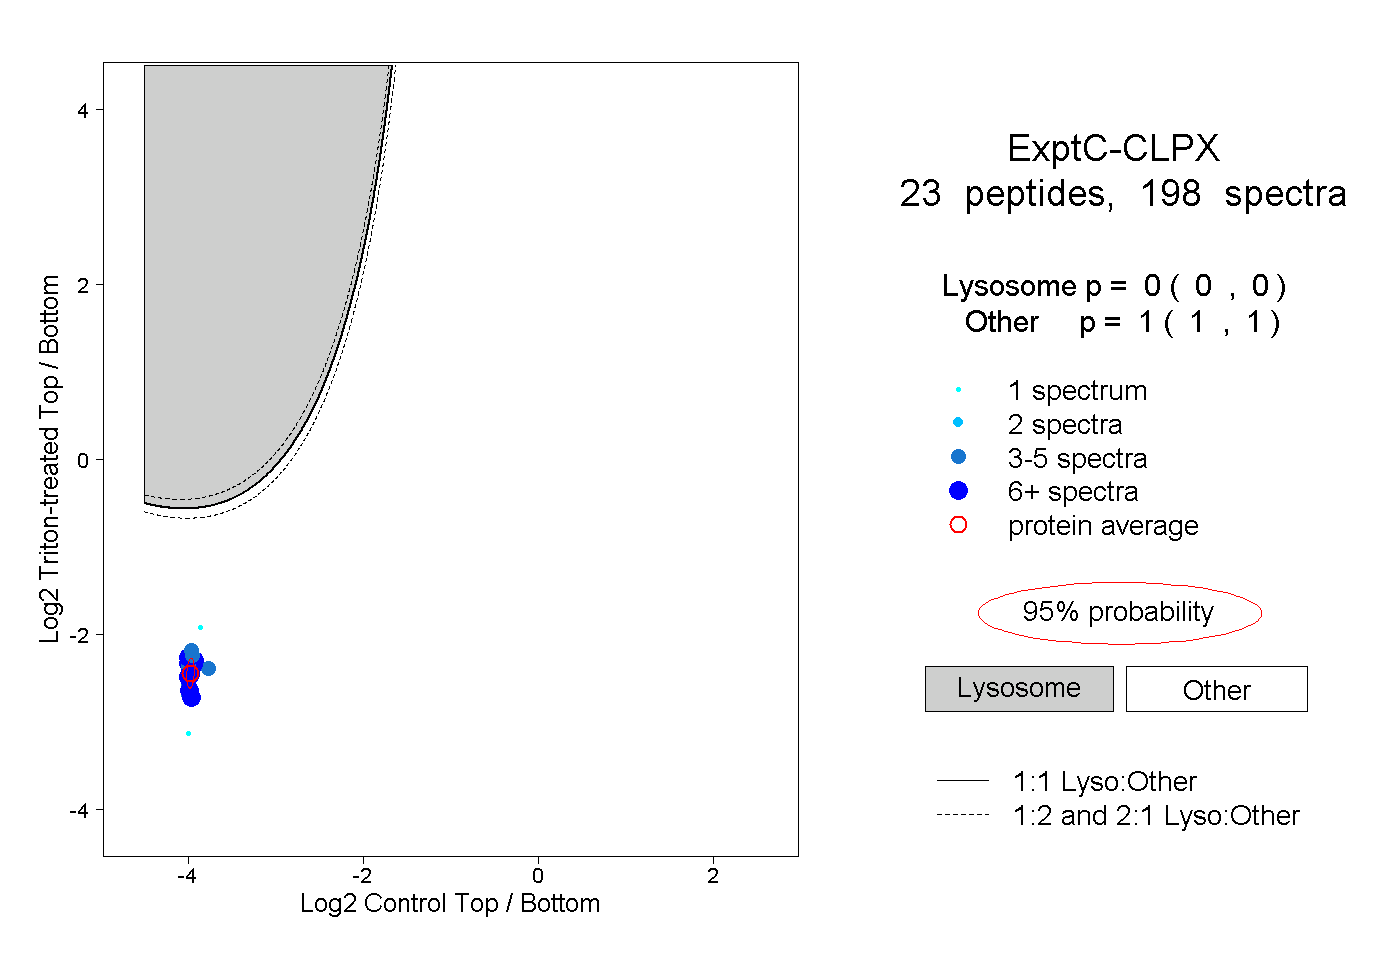 |
0.000 0.000 | 0.000 |
1.000 1.000 | 1.000 |
||||||||
| Plot | Lyso | Other | |||||||||||
| Expt D |
8 peptides |
10 spectra |
 |
0.000 0.000 | 0.000 |
1.000 1.000 | 1.000 |