 2
2peptides
spectra
0.596 | 0.735
0.000 | 0.077
0.000 | 0.000
0.000 | 0.019
0.000 | 0.000
0.209 | 0.373
0.000 | 0.000
0.000 | 0.000
1peptide
spectra
0.000 | 0.000
1.000 | 1.000
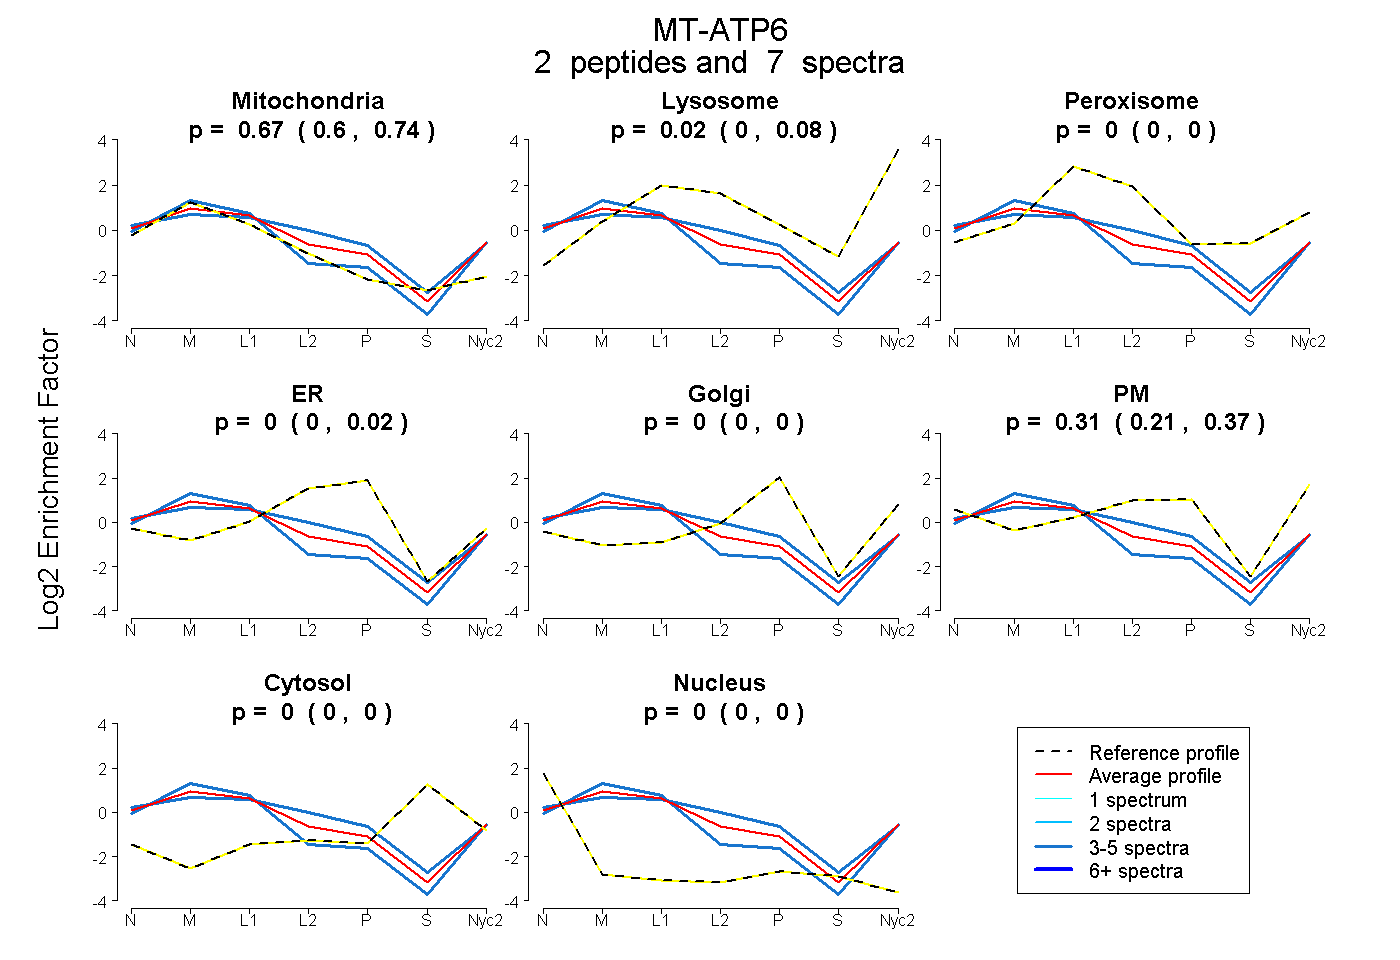
| Plot | Mito | Lyso | Perox | ER | Golgi | PM | Cytosol | Nucleus | |||||
| Expt A |
2 peptides |
7 spectra |
|
0.670 0.596 | 0.735 |
0.018 0.000 | 0.077 |
0.000 0.000 | 0.000 |
0.000 0.000 | 0.019 |
0.000 0.000 | 0.000 |
0.312 0.209 | 0.373 |
0.000 0.000 | 0.000 |
0.000 0.000 | 0.000 |
||
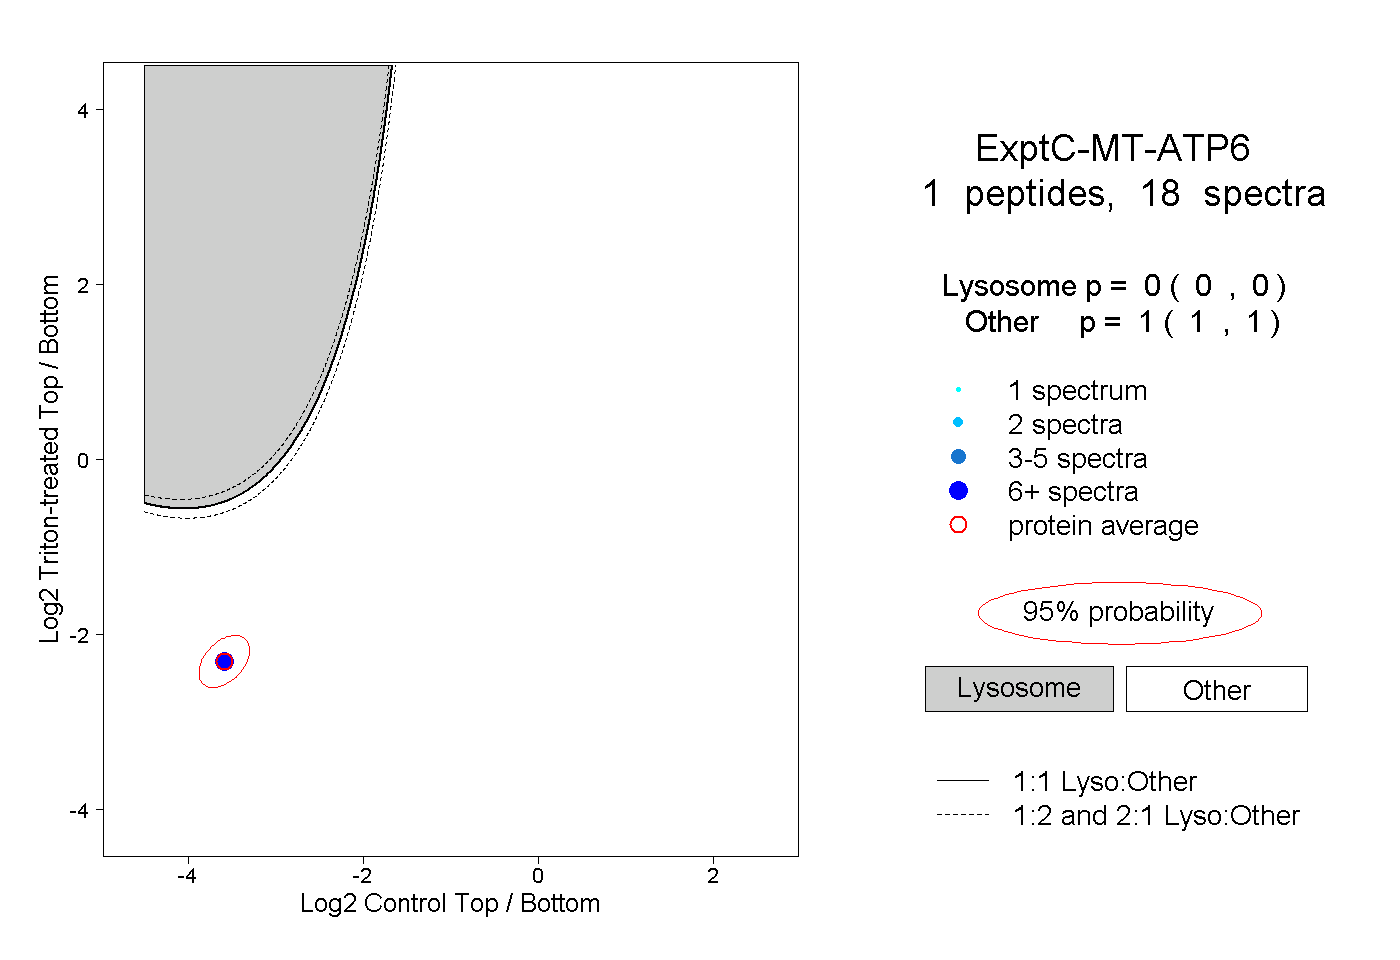
| Plot | Lyso | Other | |||||||||||
| Expt C |
1 peptide |
18 spectra |
|
0.000 0.000 | 0.000 |
1.000 1.000 | 1.000 |