 2
2peptides
spectra
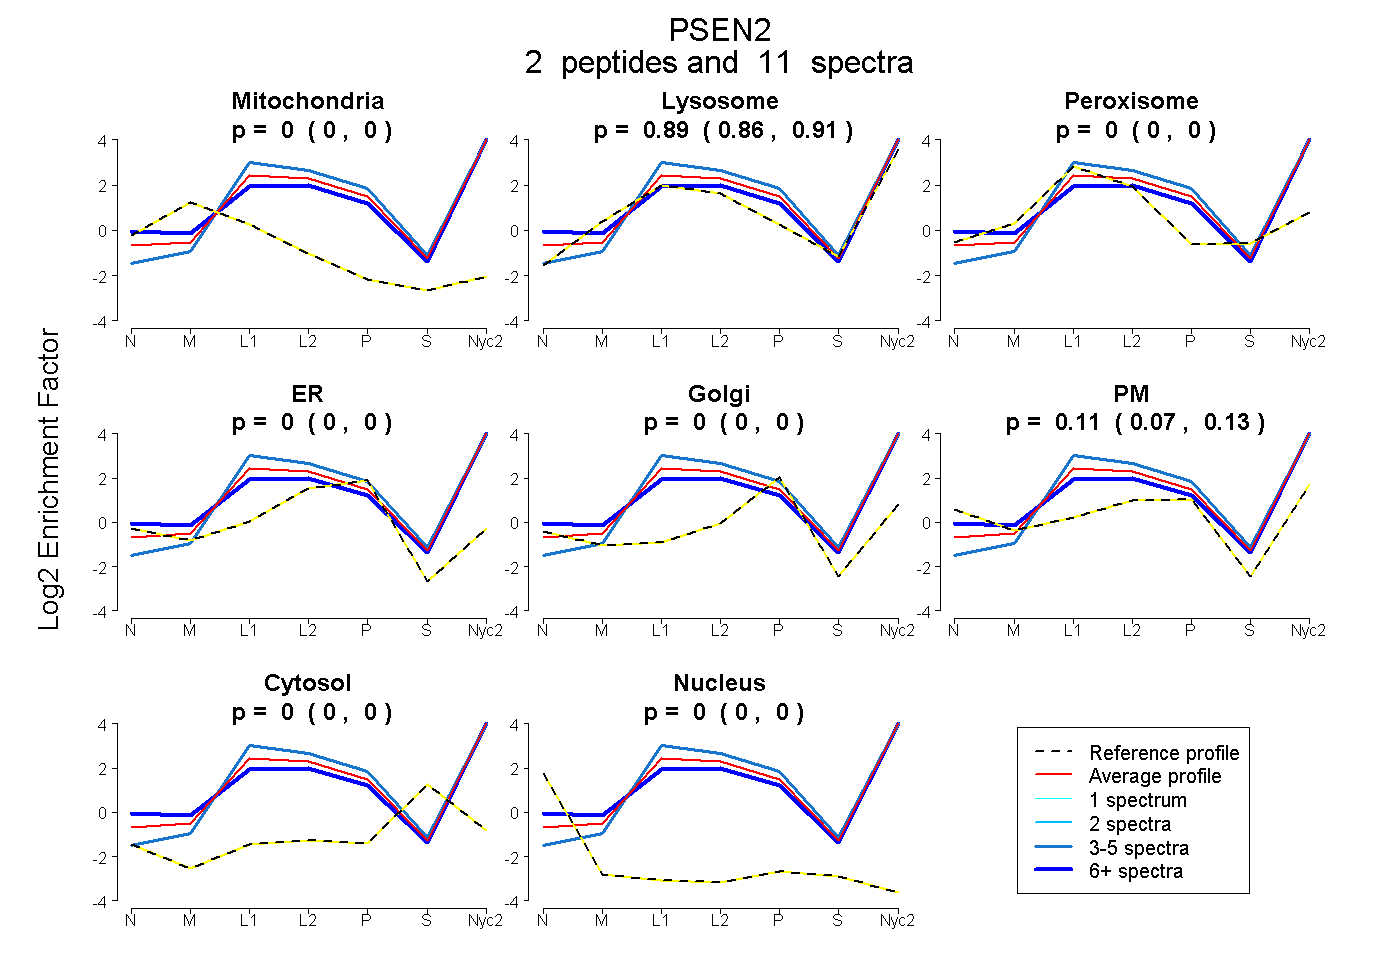
0.000 | 0.000
0.862 | 0.913
0.000 | 0.000
0.000 | 0.003
0.000 | 0.000
0.075 | 0.134
0.000 | 0.000
0.000 | 0.000
2peptides
spectra
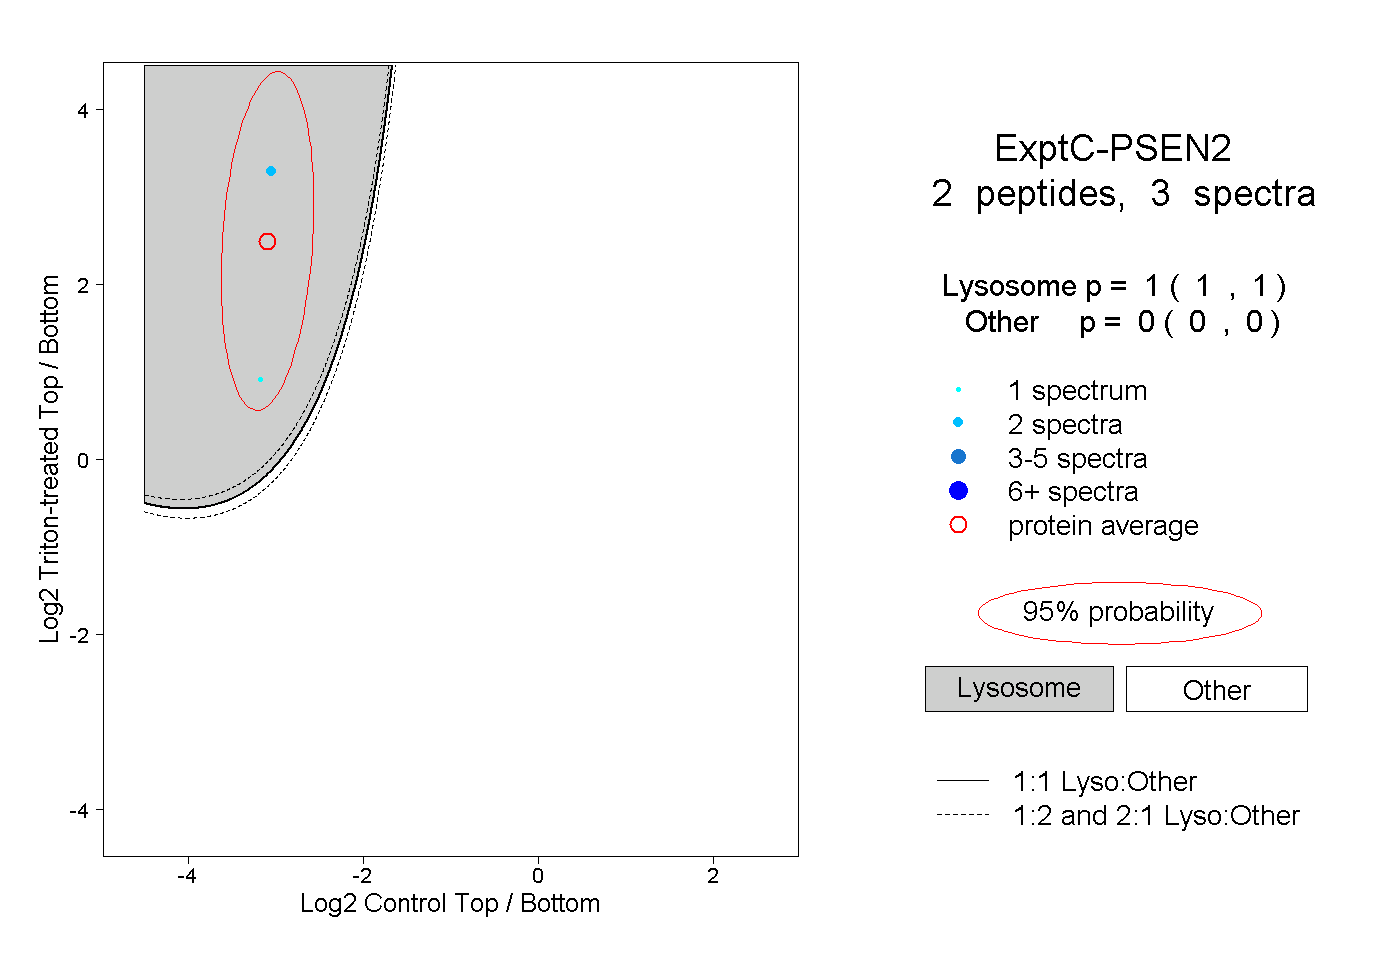
1.000 | 1.000
0.000 | 0.000
1peptide
spectra
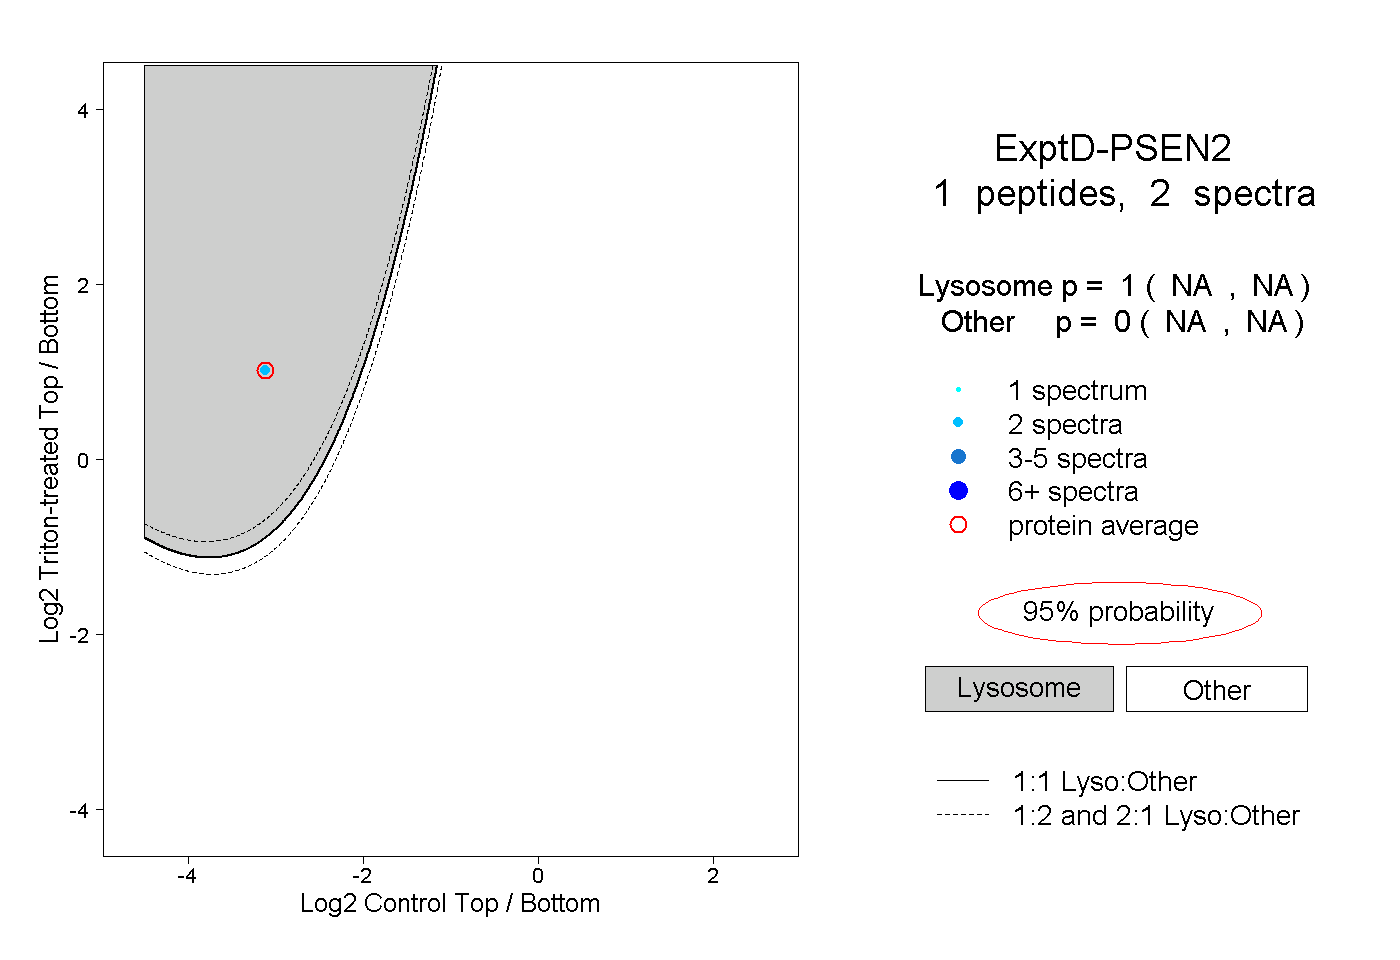
NA | NA
NA | NA