 5
5peptides
spectra
0.000 | 0.000
0.000 | 0.000
0.000 | 0.072
0.000 | 0.032
0.000 | 0.002
0.008 | 0.100
0.810 | 0.866
0.037 | 0.085
| Plot | Mito | Lyso | Perox | ER | Golgi | PM | Cytosol | Nucleus | |||||
| Expt A |
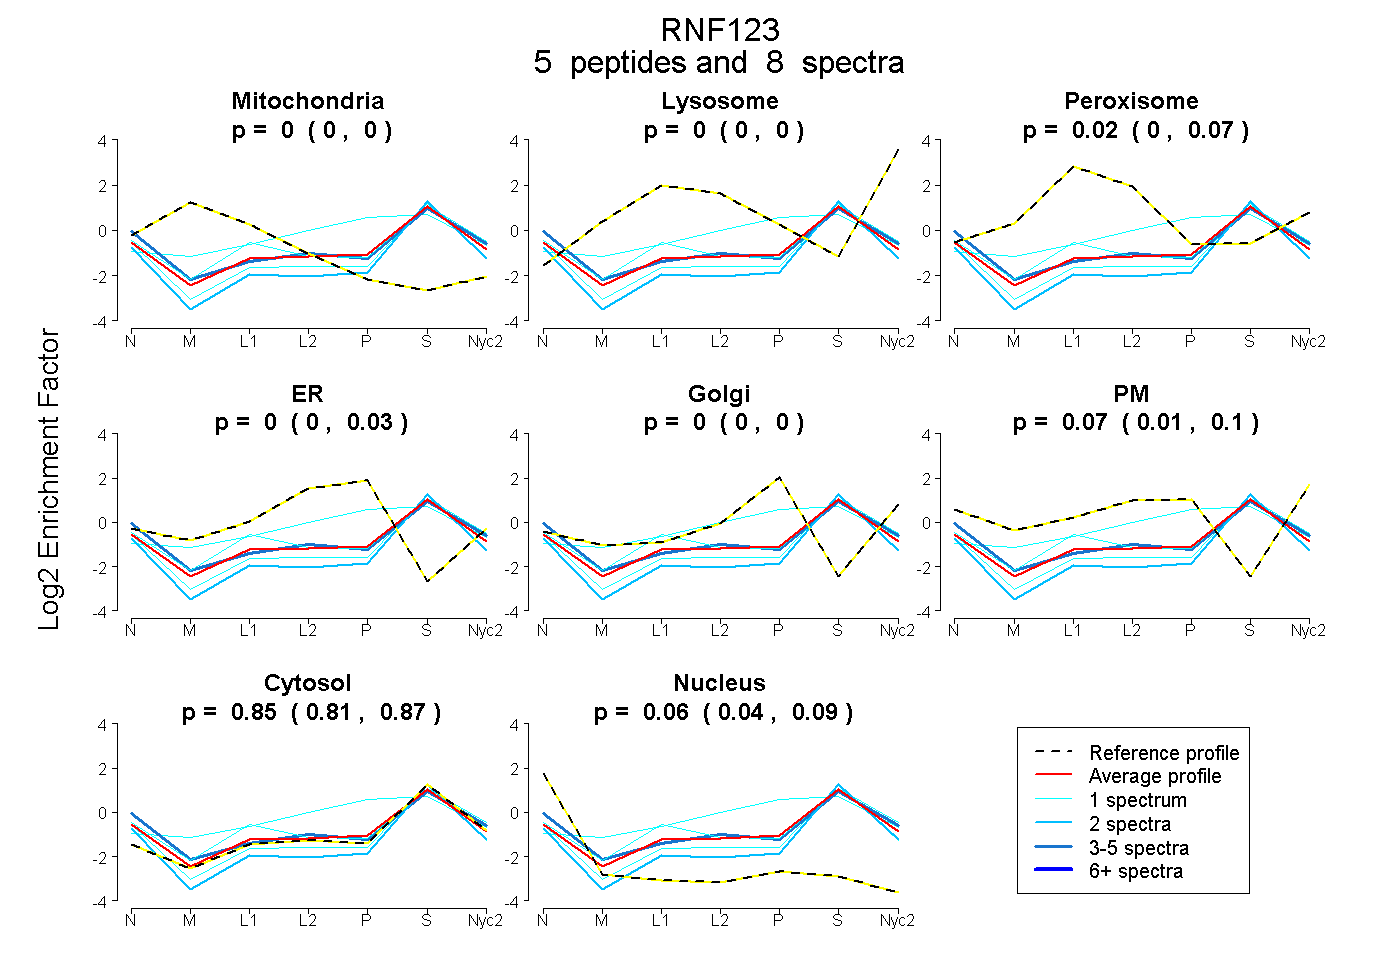
5 peptides |
8 spectra |
|
0.000 0.000 | 0.000 |
0.000 0.000 | 0.000 |
0.021 0.000 | 0.072 |
0.000 0.000 | 0.032 |
0.000 0.000 | 0.002 |
0.074 0.008 | 0.100 |
0.845 0.810 | 0.866 |
0.061 0.037 | 0.085 |
| 1 spectrum, ELIPTTWWPHR | 0.000 | 0.000 | 0.099 | 0.326 | 0.000 | 0.000 | 0.575 | 0.000 | ||
| 2 spectra, YPVAGFRPLQDPPFADLVR | 0.000 | 0.000 | 0.000 | 0.000 | 0.000 | 0.000 | 0.852 | 0.148 | ||
| 1 spectrum, LTMAVLR | 0.000 | 0.000 | 0.163 | 0.000 | 0.000 | 0.014 | 0.773 | 0.049 | ||
| 3 spectra, LGGLLSHLR | 0.000 | 0.000 | 0.018 | 0.000 | 0.000 | 0.126 | 0.772 | 0.084 | ||
| 1 spectrum, ATIVSVEDWDK | 0.000 | 0.000 | 0.000 | 0.000 | 0.000 | 0.000 | 0.870 | 0.130 |
| Plot | Mito | Lyso or Perox | ER | Golgi | PM | Cytosol | Nucleus | ||||||
| Expt B |
1 peptide |
1 spectrum |
 |
0.000 NA | NA |
0.243 NA | NA |
0.000 NA | NA |
0.000 NA | NA |
0.000 NA | NA |
0.640 NA | NA |
0.117 NA | NA |
|||
| Plot | Lyso | Other | |||||||||||
| Expt C |
2 peptides |
3 spectra |
 |
0.000 0.000 | 0.000 |
1.000 1.000 | 1.000 |