 10
10peptides
spectra

0.000 | 0.000
0.467 | 0.480
0.000 | 0.000
0.000 | 0.000
0.000 | 0.000
0.000 | 0.000
0.519 | 0.532
0.000 | 0.000
2peptides
spectra

0.000 | 0.000
0.588 | 0.712
0.000 | 0.000
0.000 | 0.019
0.000 | 0.000
0.277 | 0.385
0.000 | 0.000
7peptides
spectra
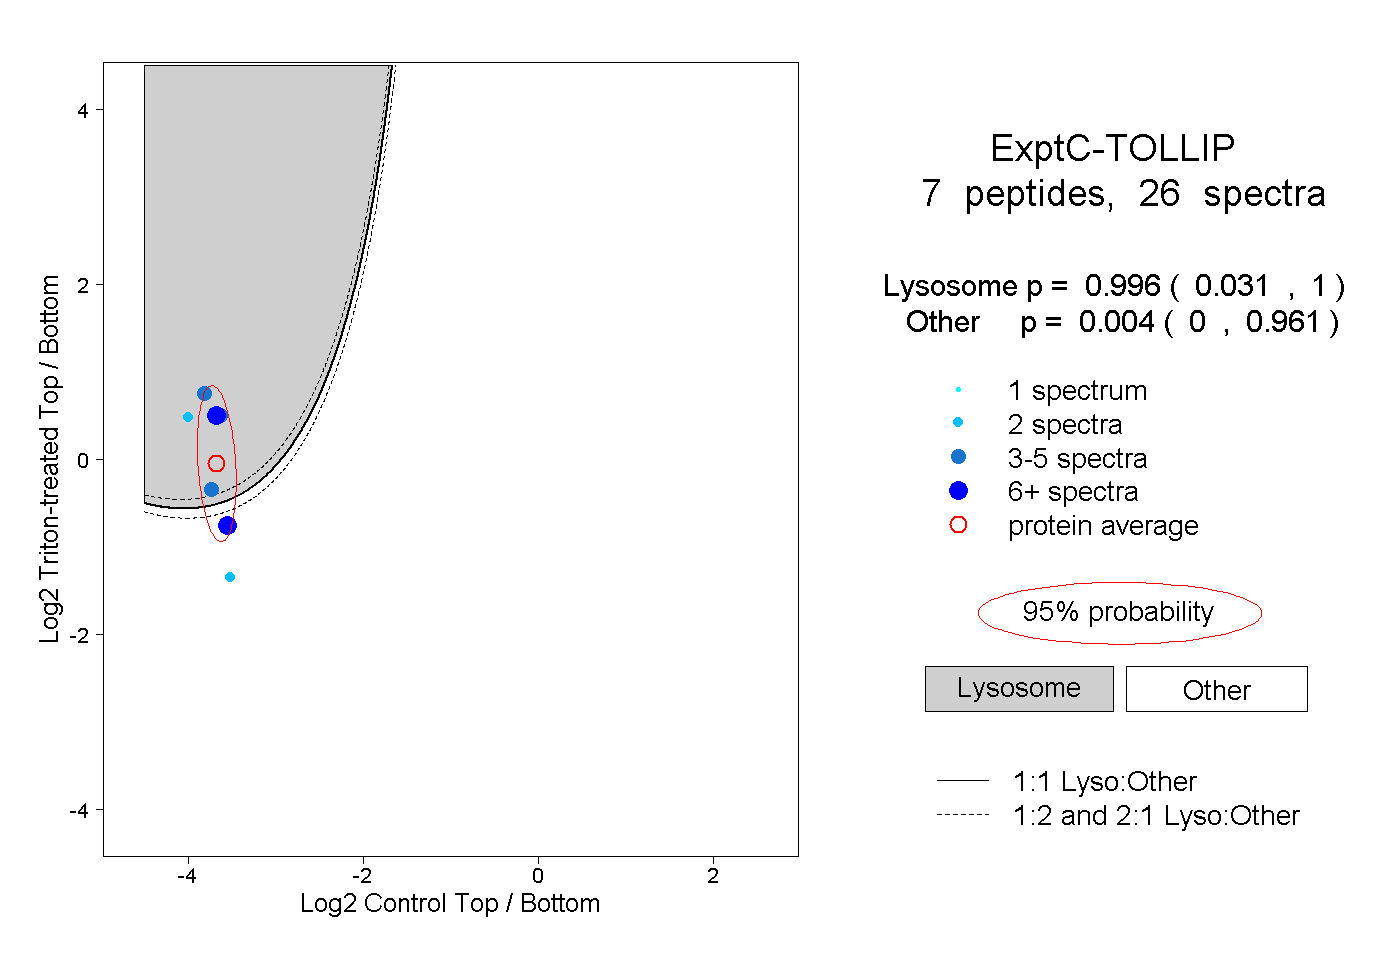
0.031 | 1.000
0.000 | 0.961
1peptide
spectrum
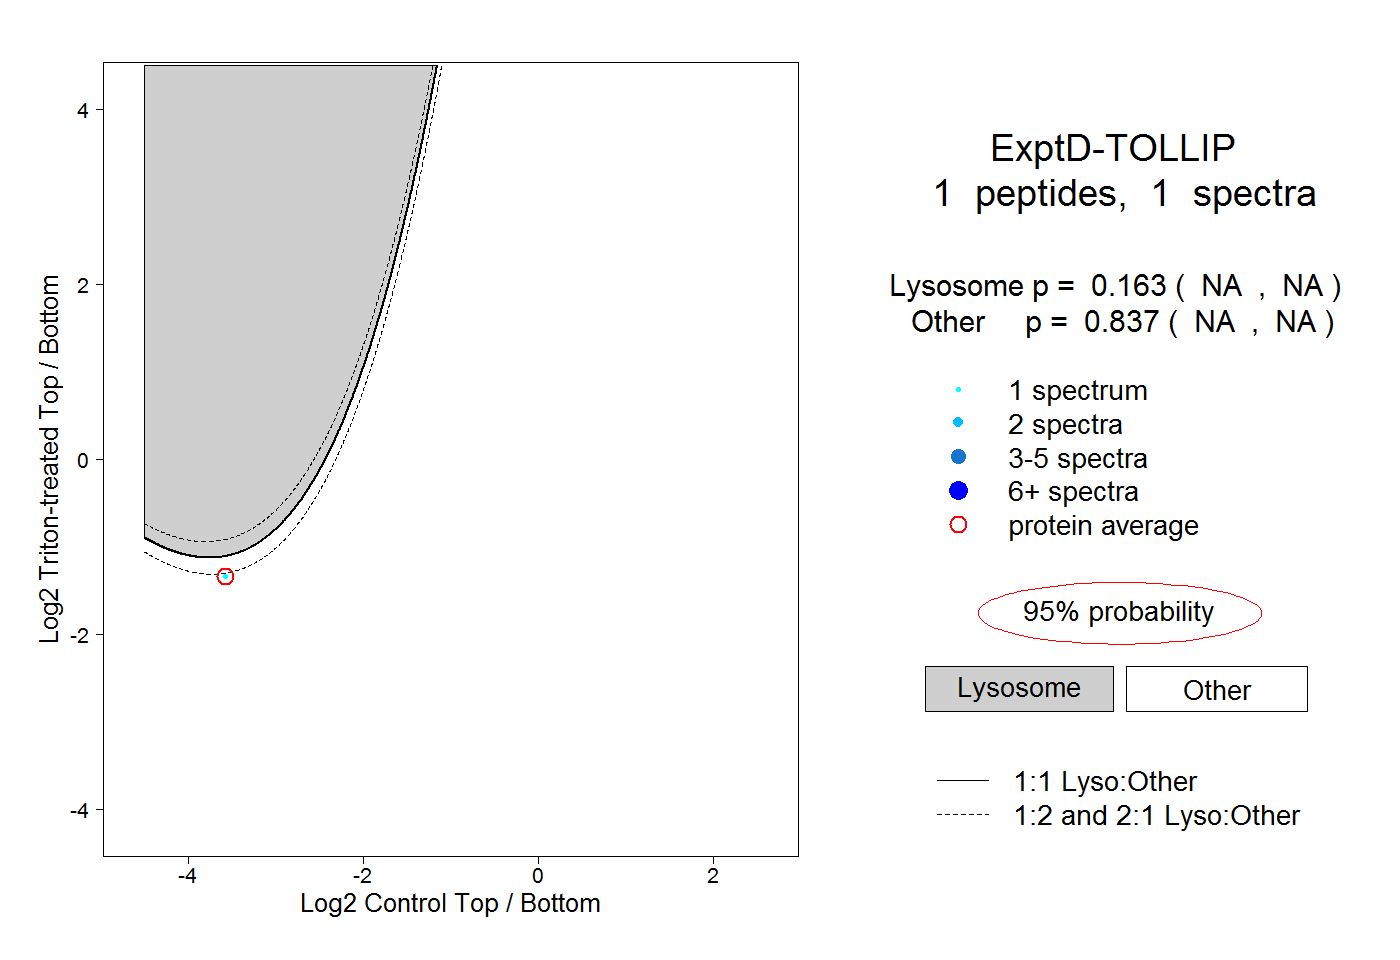
NA | NA
NA | NA