NAA25
[ENSRNOP00000049175]
Main page
| | | Plot |
Mito |
Lyso |
|
Perox |
ER |
Golgi |
PM |
Cytosol |
Nucleus |
|
| Expt A |
 12
12
peptides |
24
spectra |
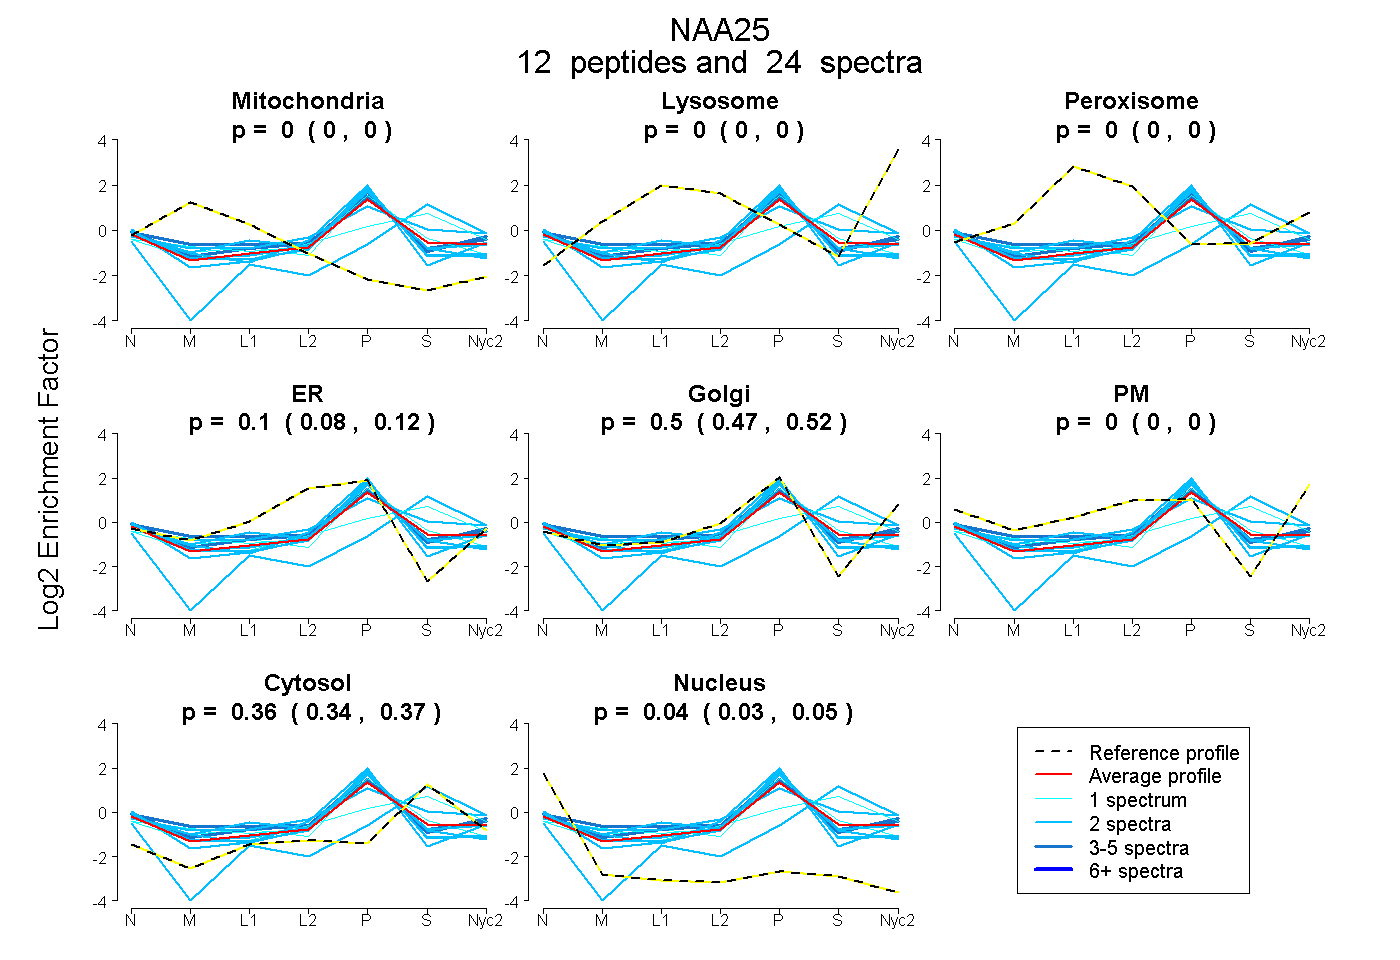 |
0.000
0.000 | 0.000 |
0.000
0.000 | 0.000 |
|
0.000
0.000 | 0.000 |
0.103
0.079 | 0.121 |
0.499
0.470 | 0.524 |
0.000
0.000 | 0.000 |
0.358
0.341 | 0.374 |
0.040
0.030 | 0.049 |
|
| | | Plot |
Mito |
|
Lyso or Perox |
|
ER |
Golgi |
PM |
Cytosol |
Nucleus |
|
| Expt B |
2
peptides |
3
spectra |
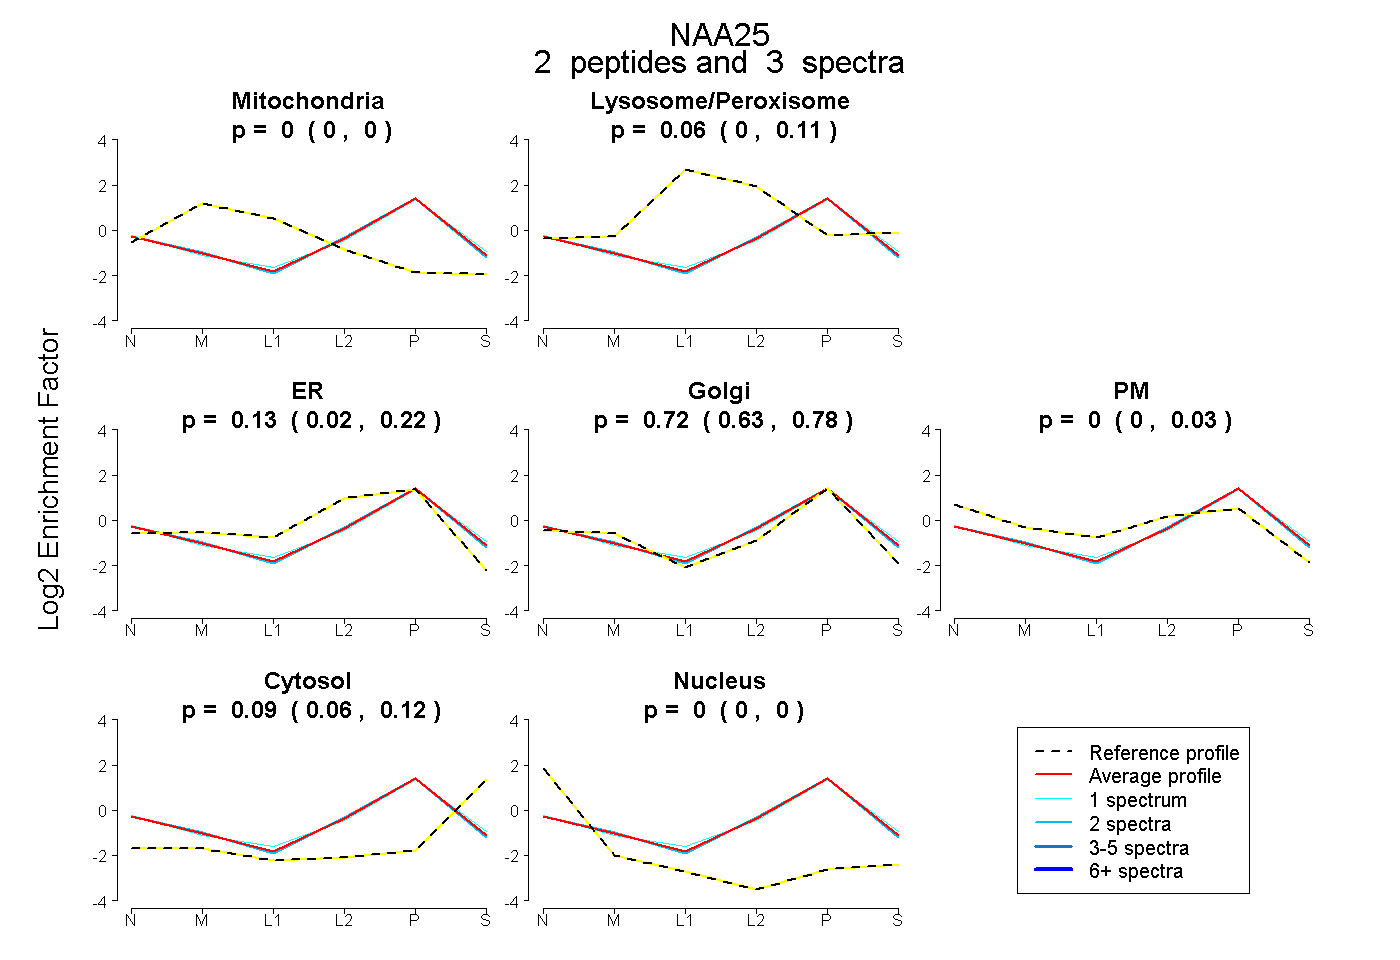 |
0.000
0.000 | 0.000 |
|
0.056
0.000 | 0.107 |
|
0.135
0.023 | 0.218 |
0.717
0.629 | 0.783 |
0.000
0.000 | 0.035 |
0.092
0.062 | 0.119 |
0.000
0.000 | 0.000 |
|
| 1 spectrum, LTSEIQSR |
0.000 |
|
0.122 |
|
0.000 |
0.789 |
0.000 |
0.089 |
0.000 |
|
| 2 spectra, IPEFIAFR |
0.000 |
|
0.013 |
|
0.223 |
0.654 |
0.012 |
0.099 |
0.000 |
|
| | | Plot |
|
Lyso |
|
|
|
|
|
|
|
Other |
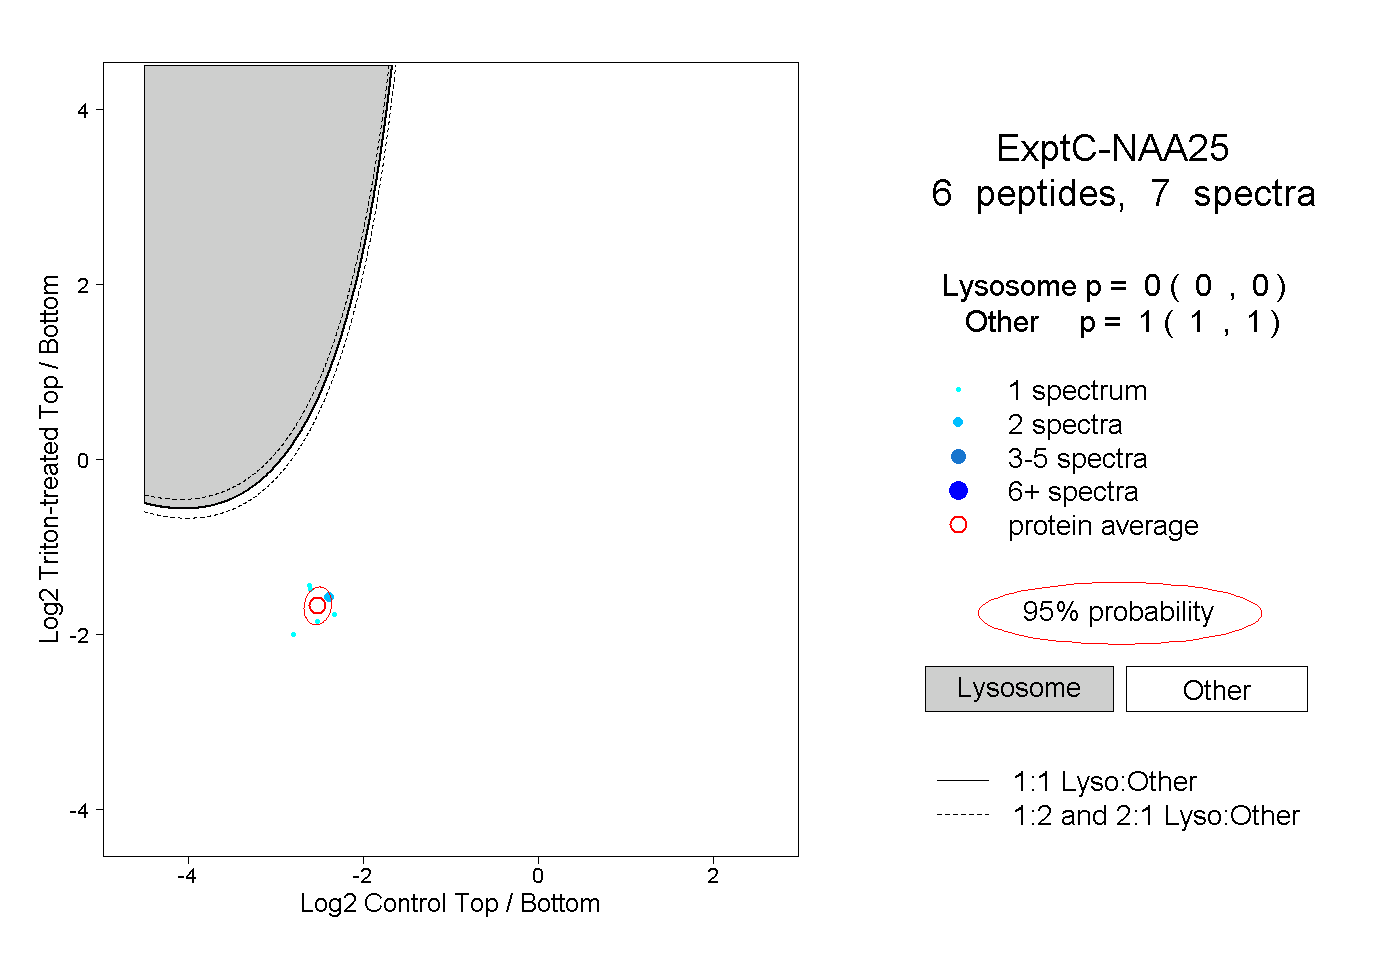
| Expt C |
6
peptides |
7
spectra |
 |
|
0.000
0.000 | 0.000 |
|
|
|
|
|
|
|
1.000
1.000 | 1.000 |