 7
7peptides
spectra
0.000 | 0.000
0.690 | 0.764
0.000 | 0.000
0.057 | 0.154
0.000 | 0.015
0.073 | 0.225
0.000 | 0.000
0.000 | 0.000
11peptides
spectra
0.000 | 1.000
0.000 | 1.000
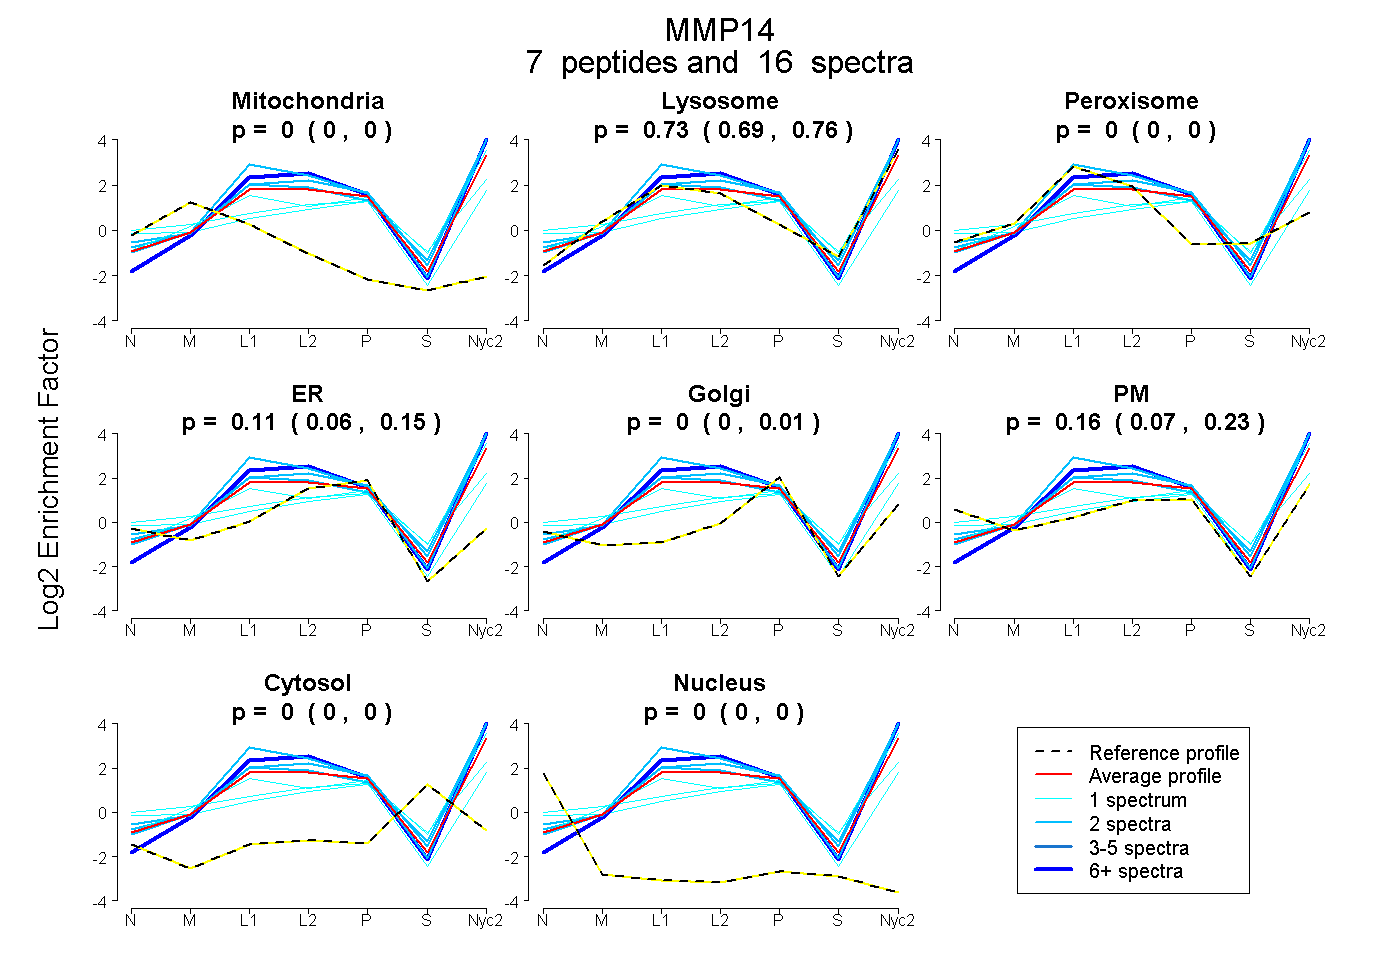
| Plot | Mito | Lyso | Perox | ER | Golgi | PM | Cytosol | Nucleus | |||||
| Expt A |
7 peptides |
16 spectra |
|
0.000 0.000 | 0.000 |
0.731 0.690 | 0.764 |
0.000 0.000 | 0.000 |
0.110 0.057 | 0.154 |
0.000 0.000 | 0.015 |
0.159 0.073 | 0.225 |
0.000 0.000 | 0.000 |
0.000 0.000 | 0.000 |
||
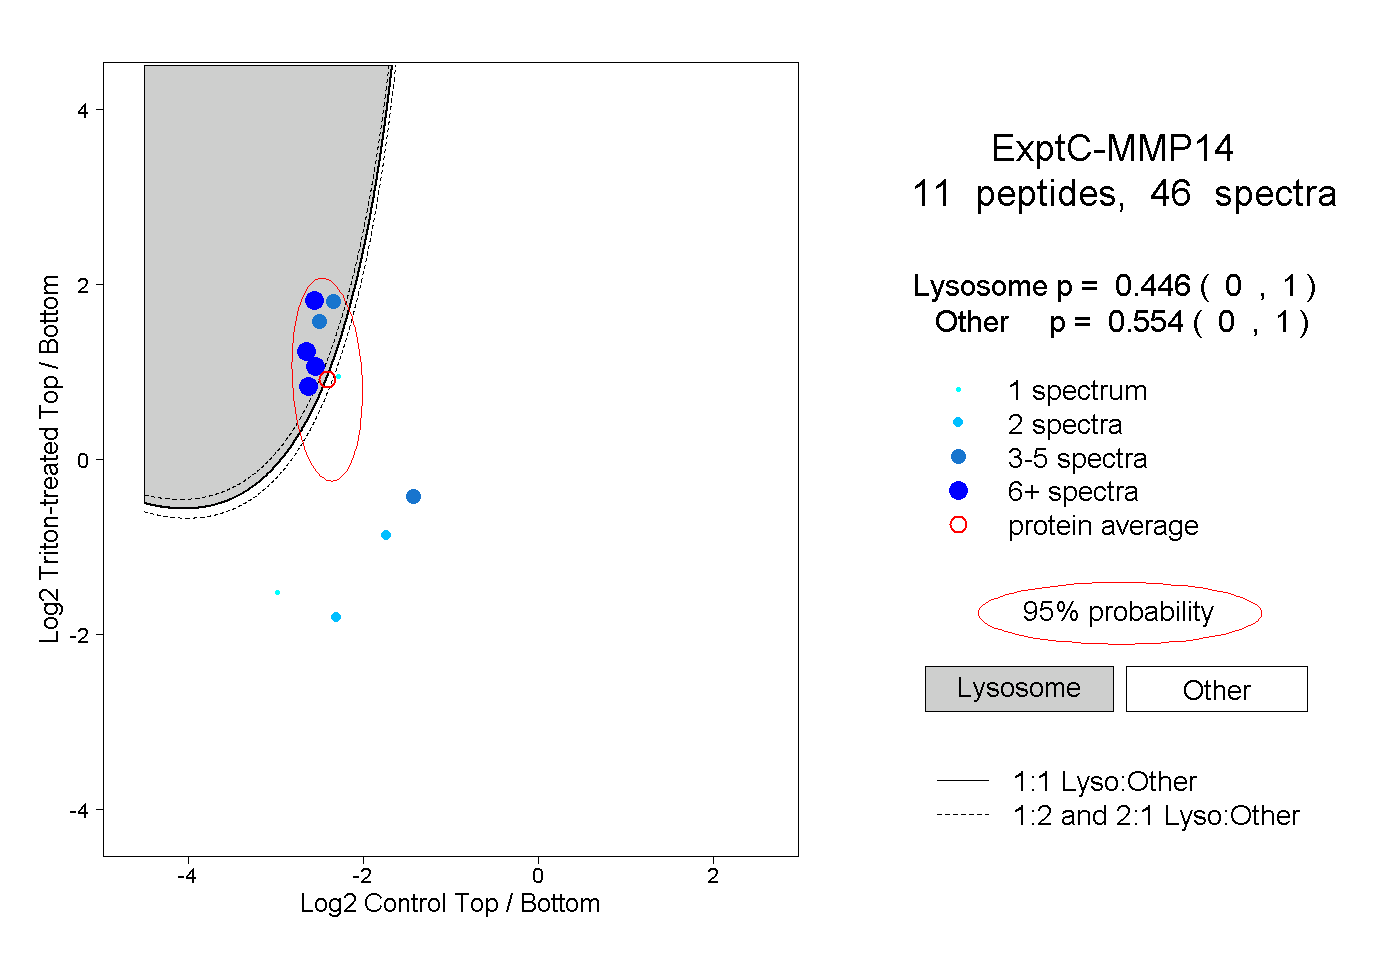
| Plot | Lyso | Other | |||||||||||
| Expt C |
11 peptides |
46 spectra |
|
0.446 0.000 | 1.000 |
0.554 0.000 | 1.000 |
| 1 spectrum, GLPTDK | 0.083 | 0.917 | ||||||||
| 6 spectra, VWEGIPESPR | 0.963 | 0.037 | ||||||||
| 4 spectra, GEMFVFK | 0.990 | 0.010 | ||||||||
| 2 spectra, ADSDTMK | 0.000 | 1.000 | ||||||||
| 4 spectra, VGEYATFEAIR | 0.000 | 1.000 | ||||||||
| 7 spectra, GLPASINTAYER | 0.999 | 0.001 | ||||||||
| 2 spectra, EVPYAYIR | 0.000 | 1.000 | ||||||||
| 6 spectra, VEPGYPK | 0.949 | 0.051 | ||||||||
| 5 spectra, AVDSEYPK | 0.998 | 0.002 | ||||||||
| 1 spectrum, MSPAPRPSR | 0.000 | 1.000 | ||||||||
| 8 spectra, FNEEFR | 1.000 | 0.000 |
| Plot | Lyso | Other | |||||||||||
| Expt D |
2 peptides |
3 spectra |
 |
0.634 0.000 | 1.000 |
0.366 0.000 | 1.000 |