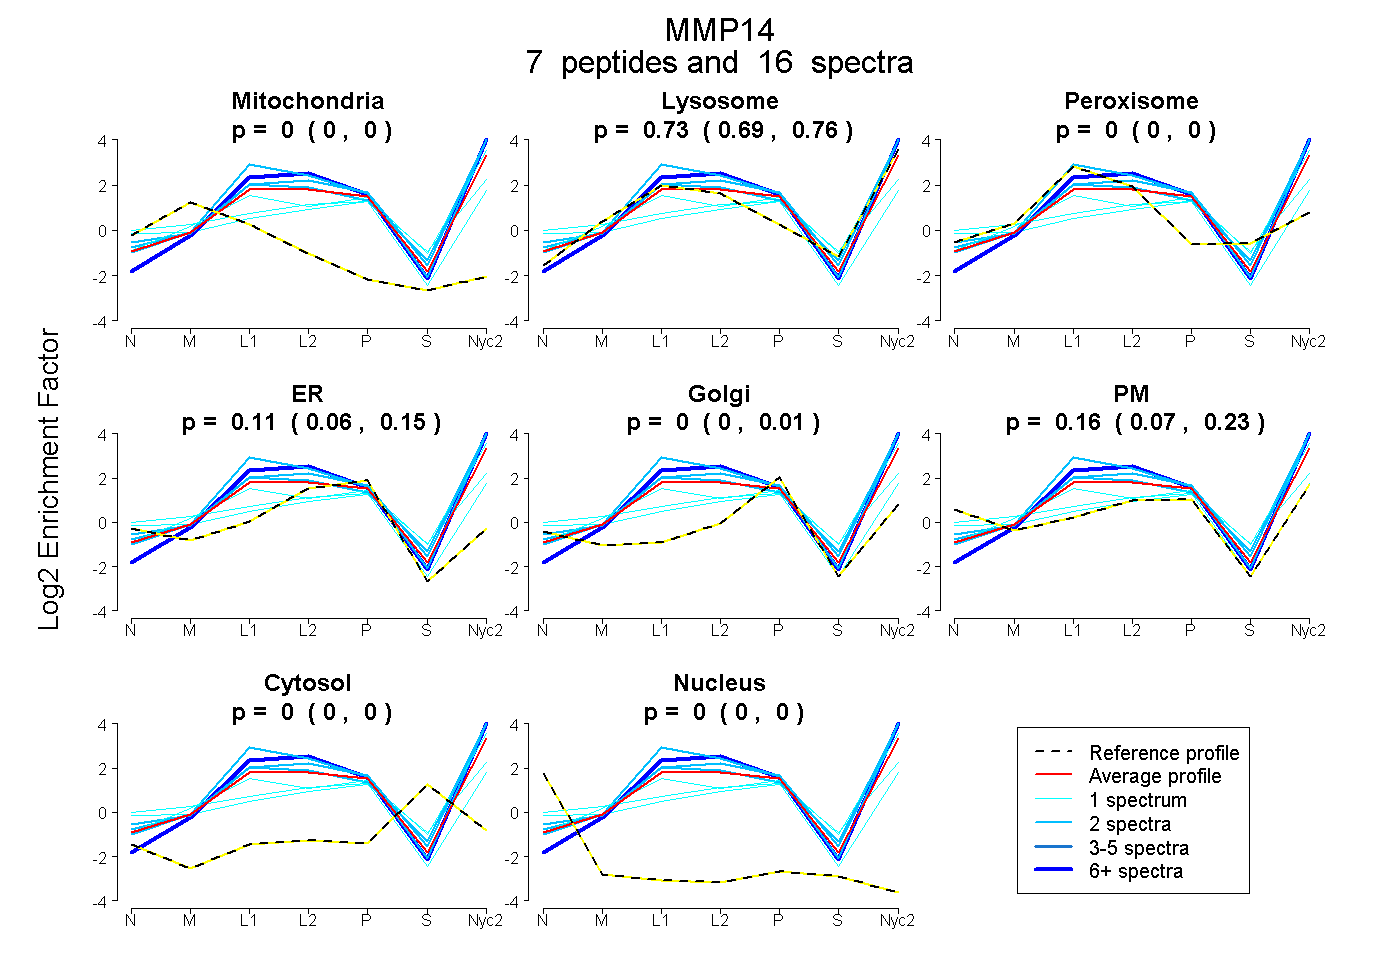
 7
7peptides
spectra
0.000 | 0.000
0.690 | 0.764
0.000 | 0.000
0.057 | 0.154
0.000 | 0.015
0.073 | 0.225
0.000 | 0.000
0.000 | 0.000
| Plot | Mito | Lyso | Perox | ER | Golgi | PM | Cytosol | Nucleus | |||||
| Expt A |
7 peptides |
16 spectra |
|
0.000 0.000 | 0.000 |
0.731 0.690 | 0.764 |
0.000 0.000 | 0.000 |
0.110 0.057 | 0.154 |
0.000 0.000 | 0.015 |
0.159 0.073 | 0.225 |
0.000 0.000 | 0.000 |
0.000 0.000 | 0.000 |
| 1 spectrum, GSFMGSDEVFTYFYK | 0.000 | 0.806 | 0.000 | 0.000 | 0.194 | 0.000 | 0.000 | 0.000 | ||
| 2 spectra, VWEGIPESPR | 0.000 | 0.871 | 0.000 | 0.010 | 0.000 | 0.119 | 0.000 | 0.000 | ||
| 2 spectra, GEMFVFK | 0.000 | 0.824 | 0.000 | 0.000 | 0.000 | 0.176 | 0.000 | 0.000 | ||
| 1 spectrum, LLYCQR | 0.007 | 0.220 | 0.000 | 0.153 | 0.000 | 0.620 | 0.000 | 0.000 | ||
| 2 spectra, GLPASINTAYER | 0.000 | 0.911 | 0.000 | 0.012 | 0.000 | 0.077 | 0.000 | 0.000 | ||
| 1 spectrum, EVPYAYIR | 0.000 | 0.382 | 0.000 | 0.000 | 0.138 | 0.407 | 0.073 | 0.000 | ||
| 7 spectra, FNEEFR | 0.000 | 0.941 | 0.000 | 0.059 | 0.000 | 0.000 | 0.000 | 0.000 |
| Plot | Lyso | Other | |||||||||||
| Expt C |
11 peptides |
46 spectra |
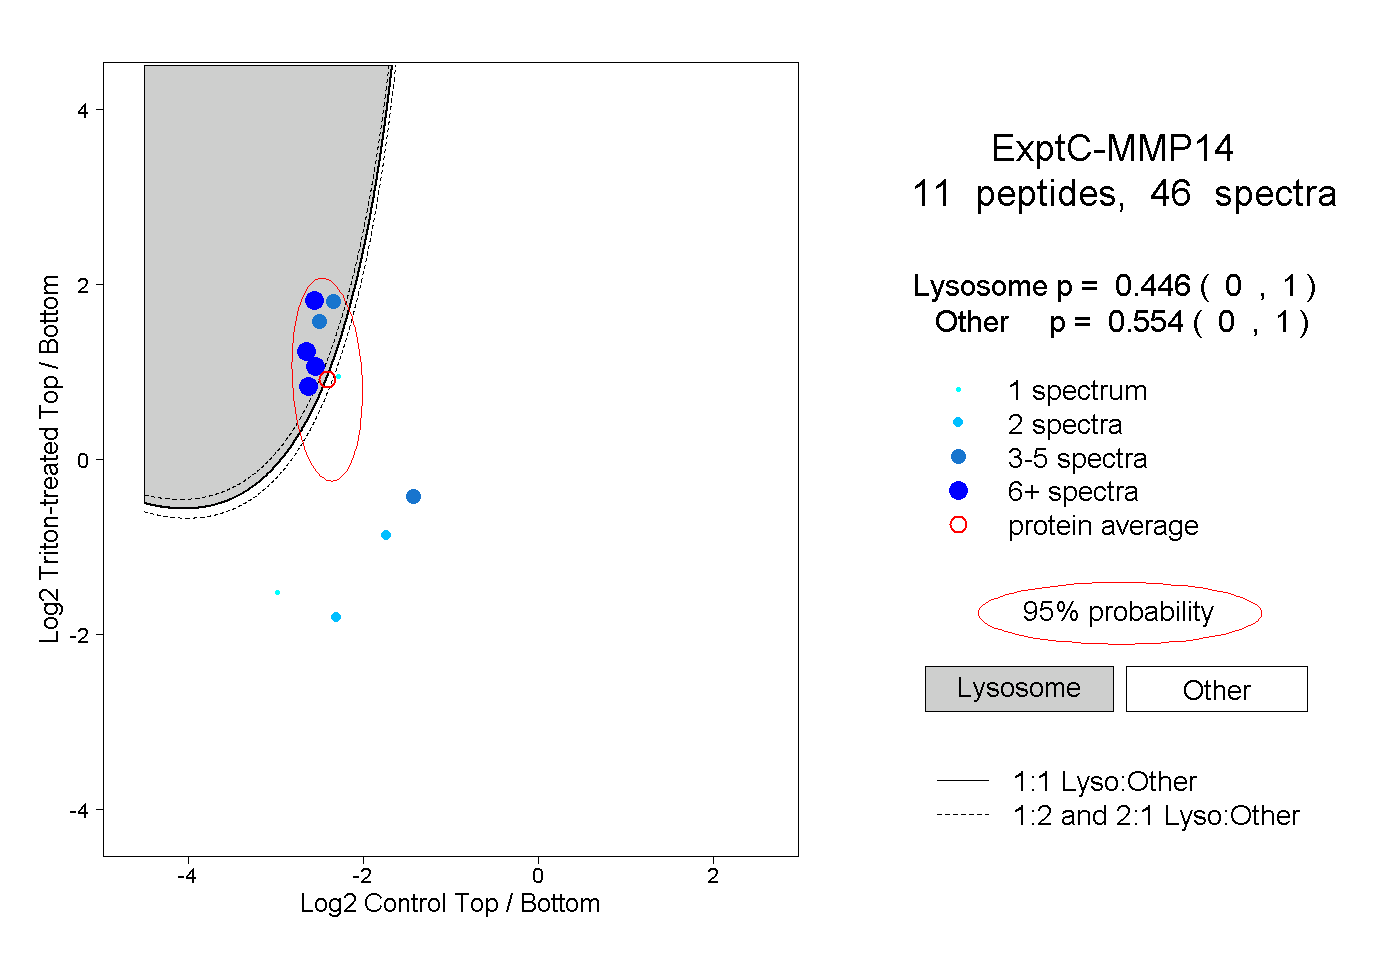 |
0.446 0.000 | 1.000 |
0.554 0.000 | 1.000 |
||||||||
| Plot | Lyso | Other | |||||||||||
| Expt D |
2 peptides |
3 spectra |
 |
0.634 0.000 | 1.000 |
0.366 0.000 | 1.000 |