 3
3peptides
spectra
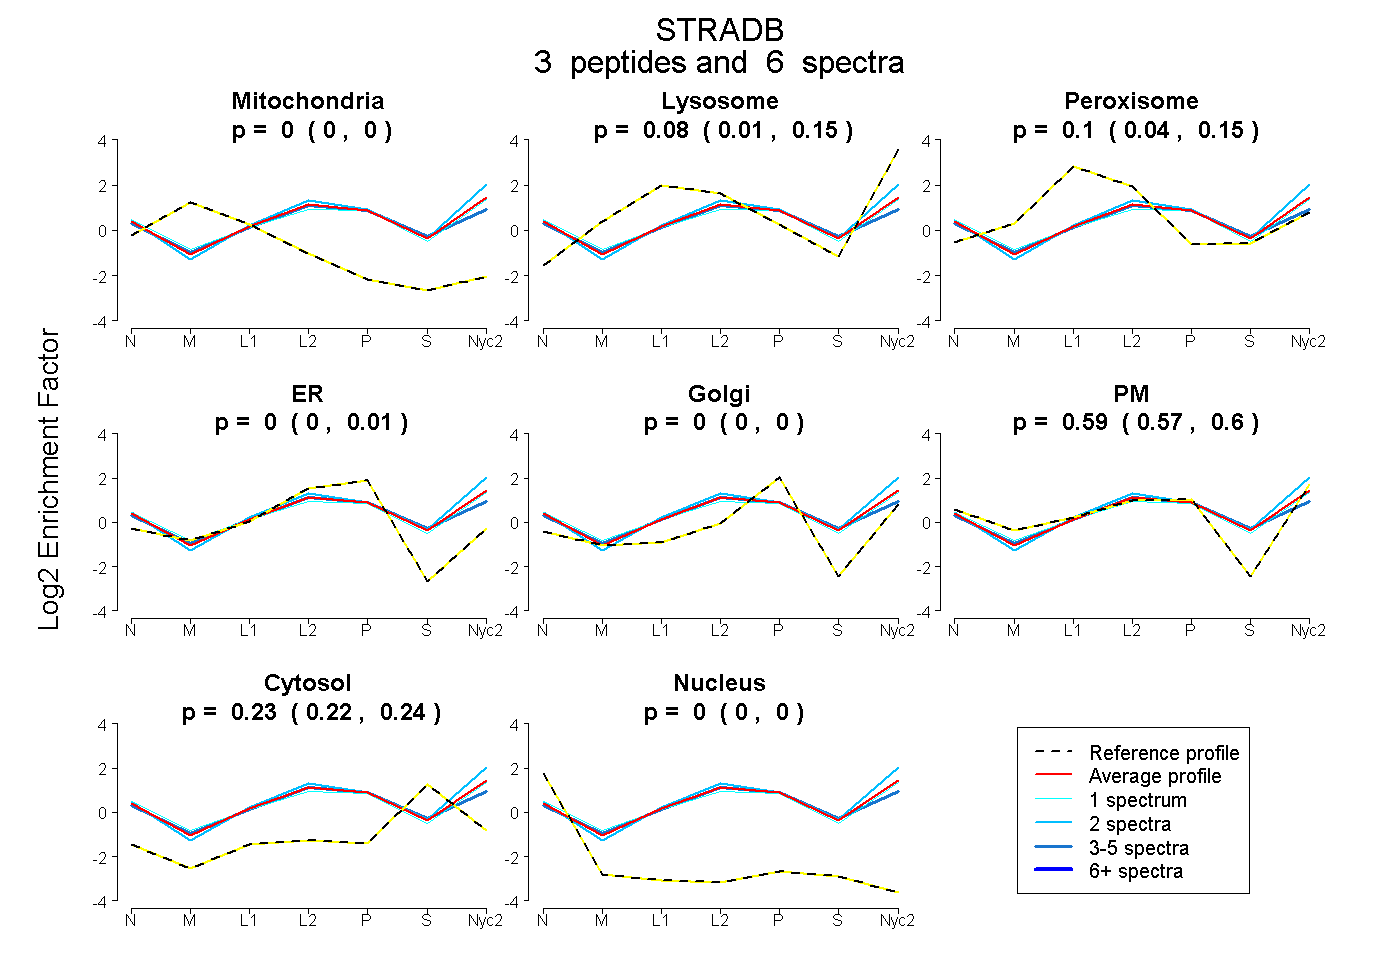
0.000 | 0.000
0.009 | 0.149
0.036 | 0.148
0.000 | 0.010
0.000 | 0.000
0.572 | 0.604
0.216 | 0.237
0.000 | 0.000
1peptide
spectra
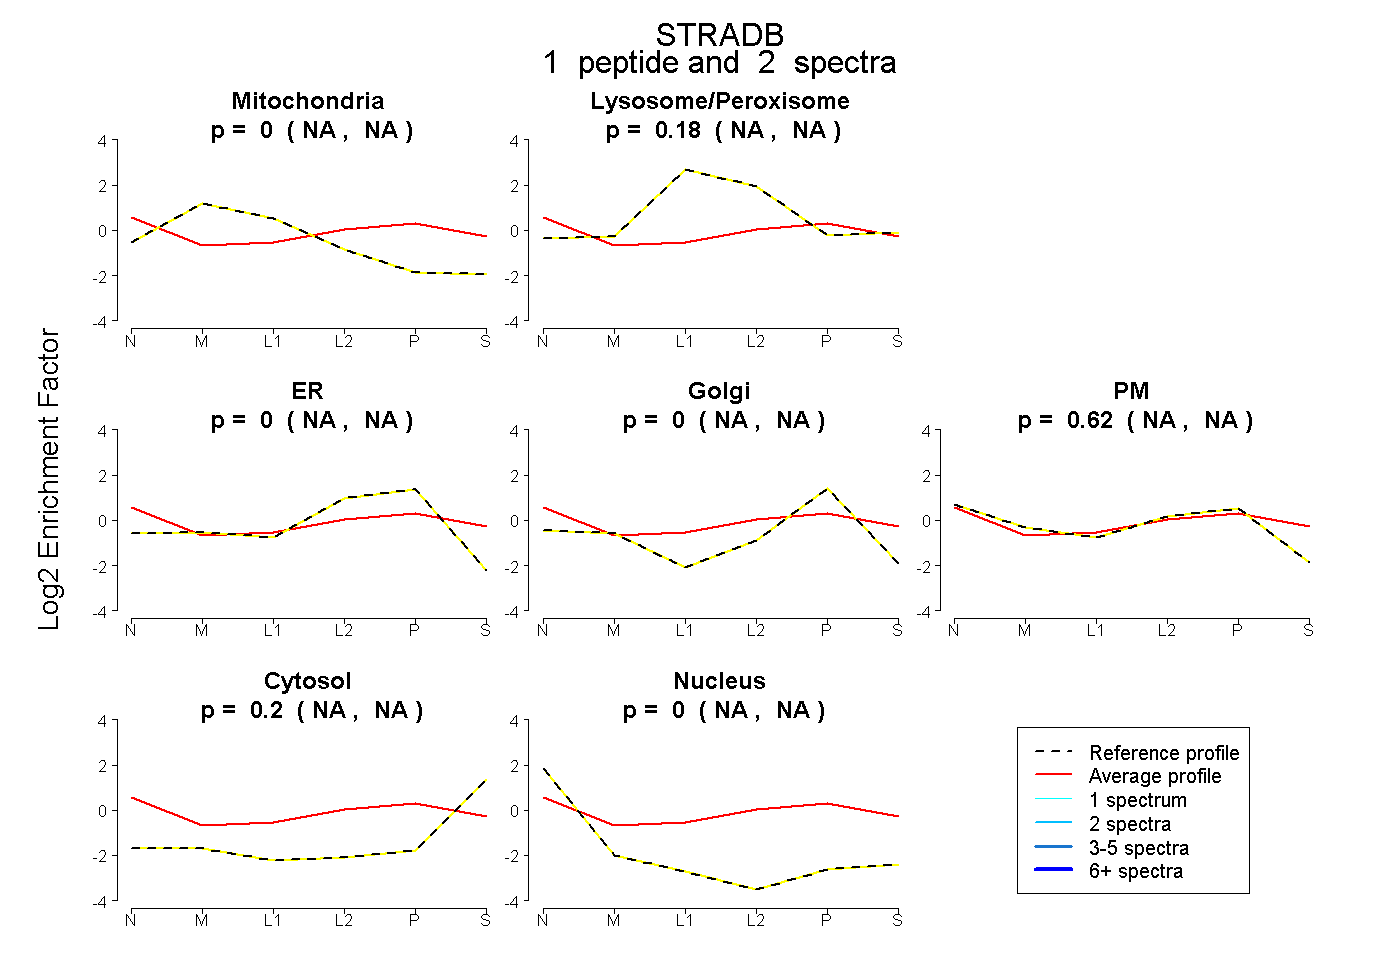
NA | NA
NA | NA
NA | NA
NA | NA
NA | NA
NA | NA
NA | NA
4peptides
spectra
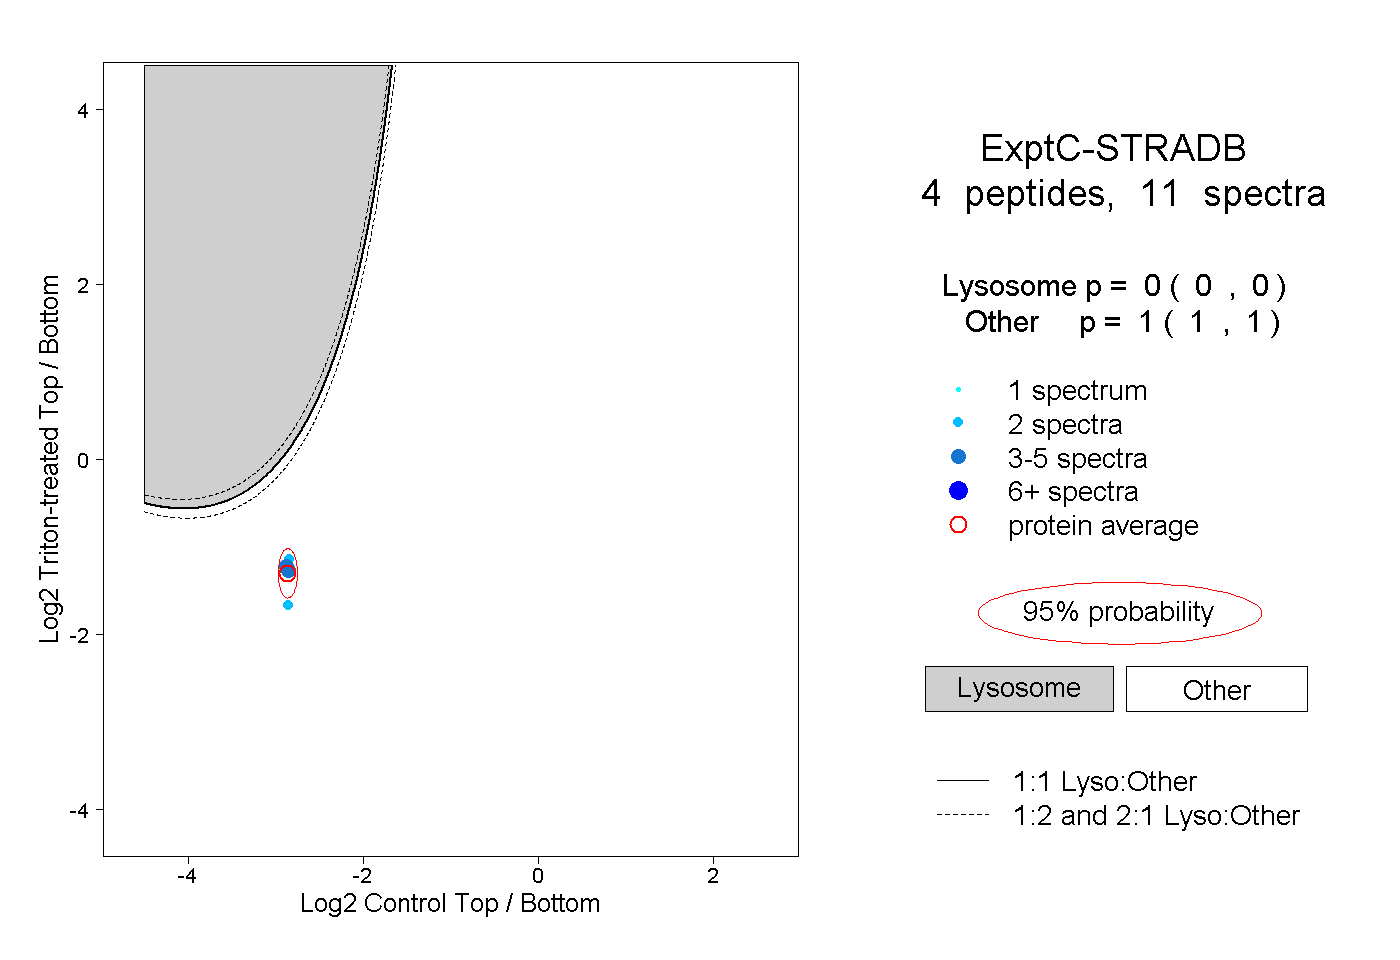
0.000 | 0.000
1.000 | 1.000