RGD1304704
[ENSRNOP00000049155]
Main page
| | | Plot |
Mito |
Lyso |
|
Perox |
ER |
Golgi |
PM |
Cytosol |
Nucleus |
|
| Expt A |
 7
7
peptides |
25
spectra |
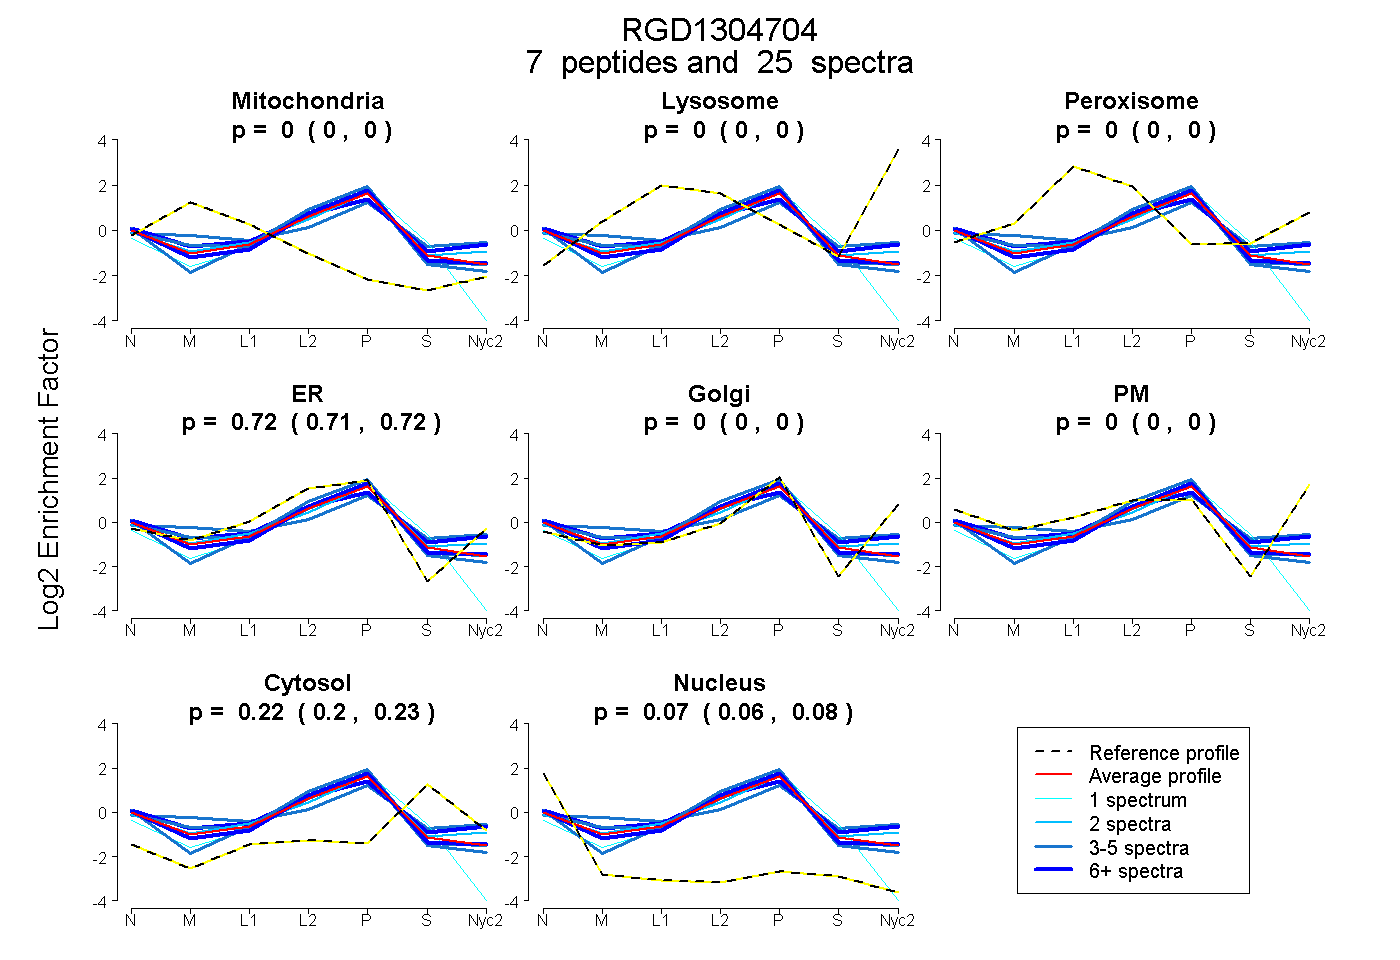 |
0.000
0.000 | 0.000 |
0.000
0.000 | 0.000 |
|
0.000
0.000 | 0.000 |
0.715
0.707 | 0.722 |
0.000
0.000 | 0.000 |
0.000
0.000 | 0.000 |
0.215
0.203 | 0.225 |
0.070
0.057 | 0.080 |
|
| | | Plot |
Mito |
|
Lyso or Perox |
|
ER |
Golgi |
PM |
Cytosol |
Nucleus |
|
| Expt B |
5
peptides |
15
spectra |
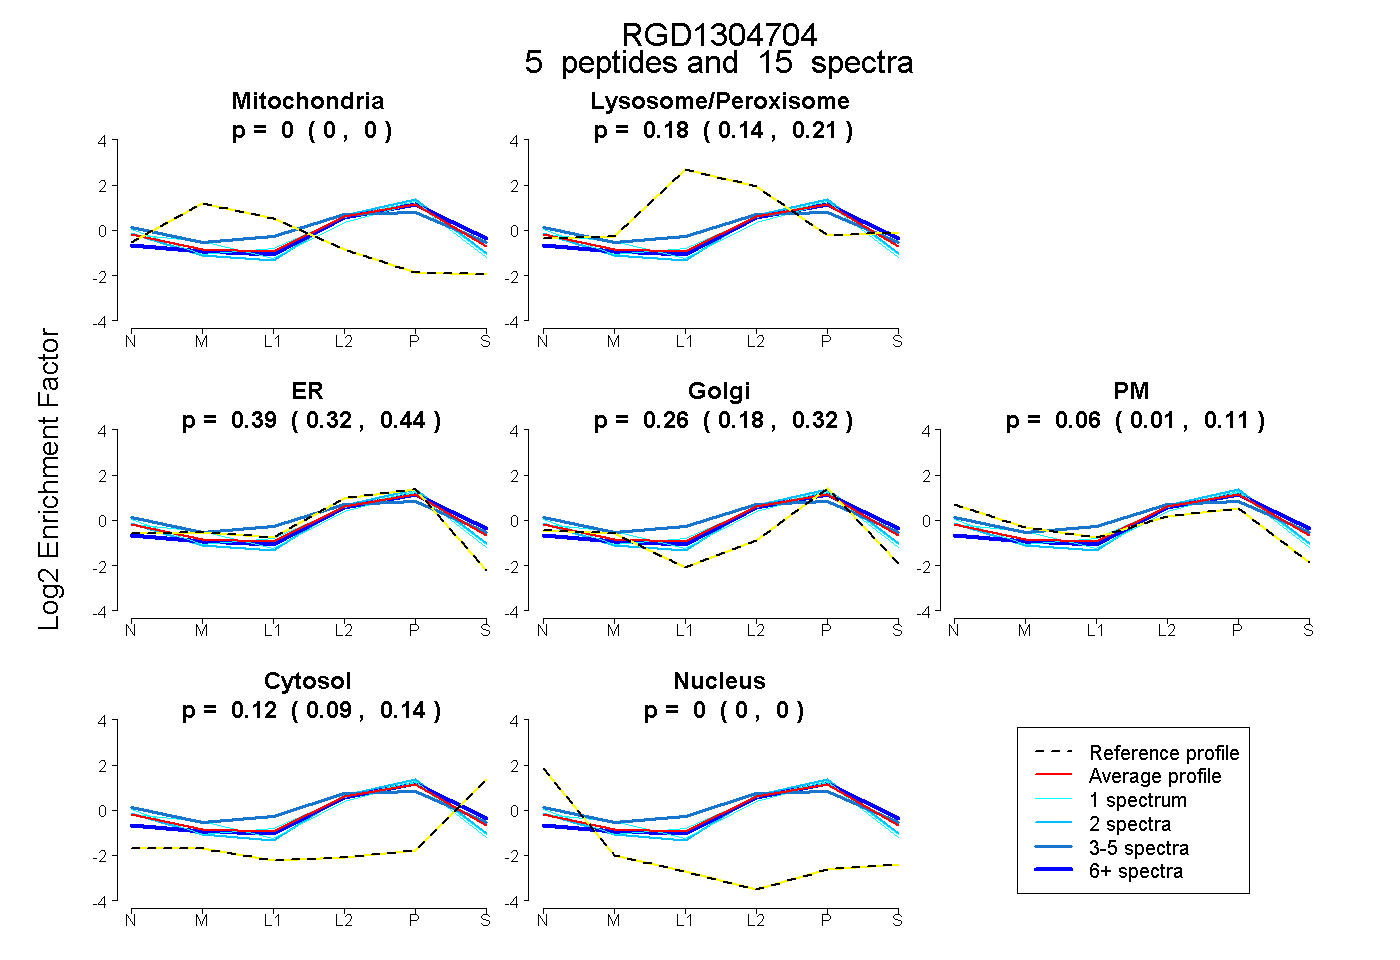 |
0.000
0.000 | 0.000 |
|
0.180
0.137 | 0.215 |
|
0.386
0.319 | 0.443 |
0.256
0.184 | 0.318 |
0.061
0.006 | 0.108 |
0.116
0.094 | 0.135 |
0.000
0.000 | 0.000 |
|
| 1 spectrum, LTQDAVAK |
0.000 |
|
0.089 |
|
0.353 |
0.351 |
0.148 |
0.060 |
0.000 |
|
| 2 spectra, EGLPVALDK |
0.000 |
|
0.000 |
|
0.688 |
0.073 |
0.099 |
0.140 |
0.000 |
|
| 7 spectra, LLHIEELR |
0.000 |
|
0.110 |
|
0.586 |
0.075 |
0.000 |
0.228 |
0.000 |
|
| 4 spectra, NFIVWLEDQK |
0.000 |
|
0.347 |
|
0.059 |
0.277 |
0.259 |
0.057 |
0.000 |
|
| 1 spectrum, NADNAAK |
0.000 |
|
0.155 |
|
0.366 |
0.263 |
0.161 |
0.054 |
0.000 |
|
| | | Plot |
|
Lyso |
|
|
|
|
|
|
|
Other |
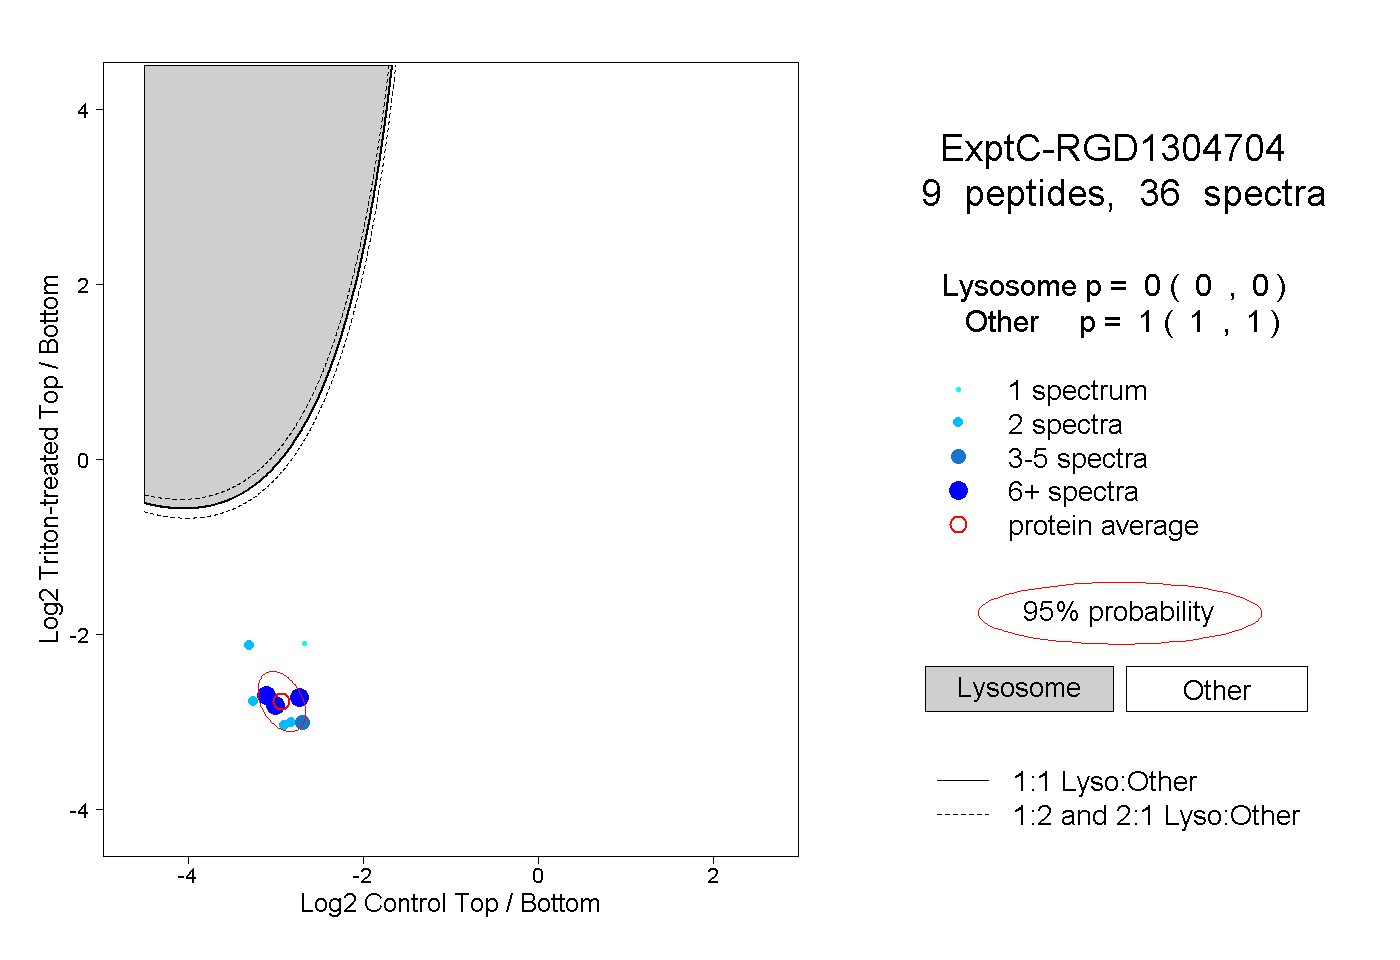
| Expt C |
9
peptides |
36
spectra |
 |
|
0.000
0.000 | 0.000 |
|
|
|
|
|
|
|
1.000
1.000 | 1.000 |
| | | Plot |
|
Lyso |
|
|
|
|
|
|
|
Other |
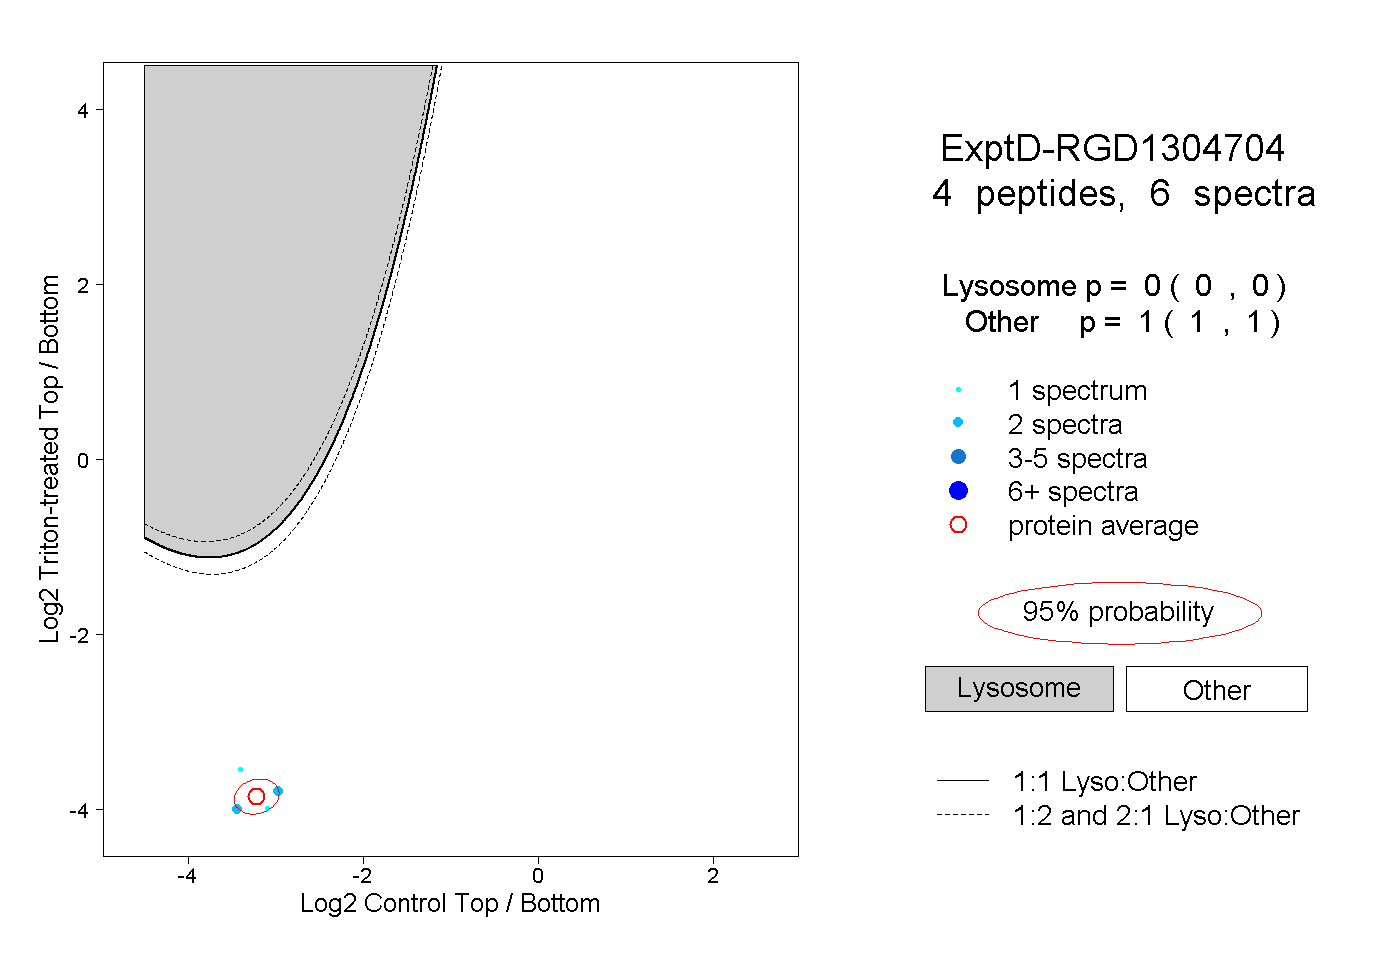
| Expt D |
4
peptides |
6
spectra |
 |
|
0.000
0.000 | 0.000 |
|
|
|
|
|
|
|
1.000
1.000 | 1.000 |