 2
2peptides
spectra
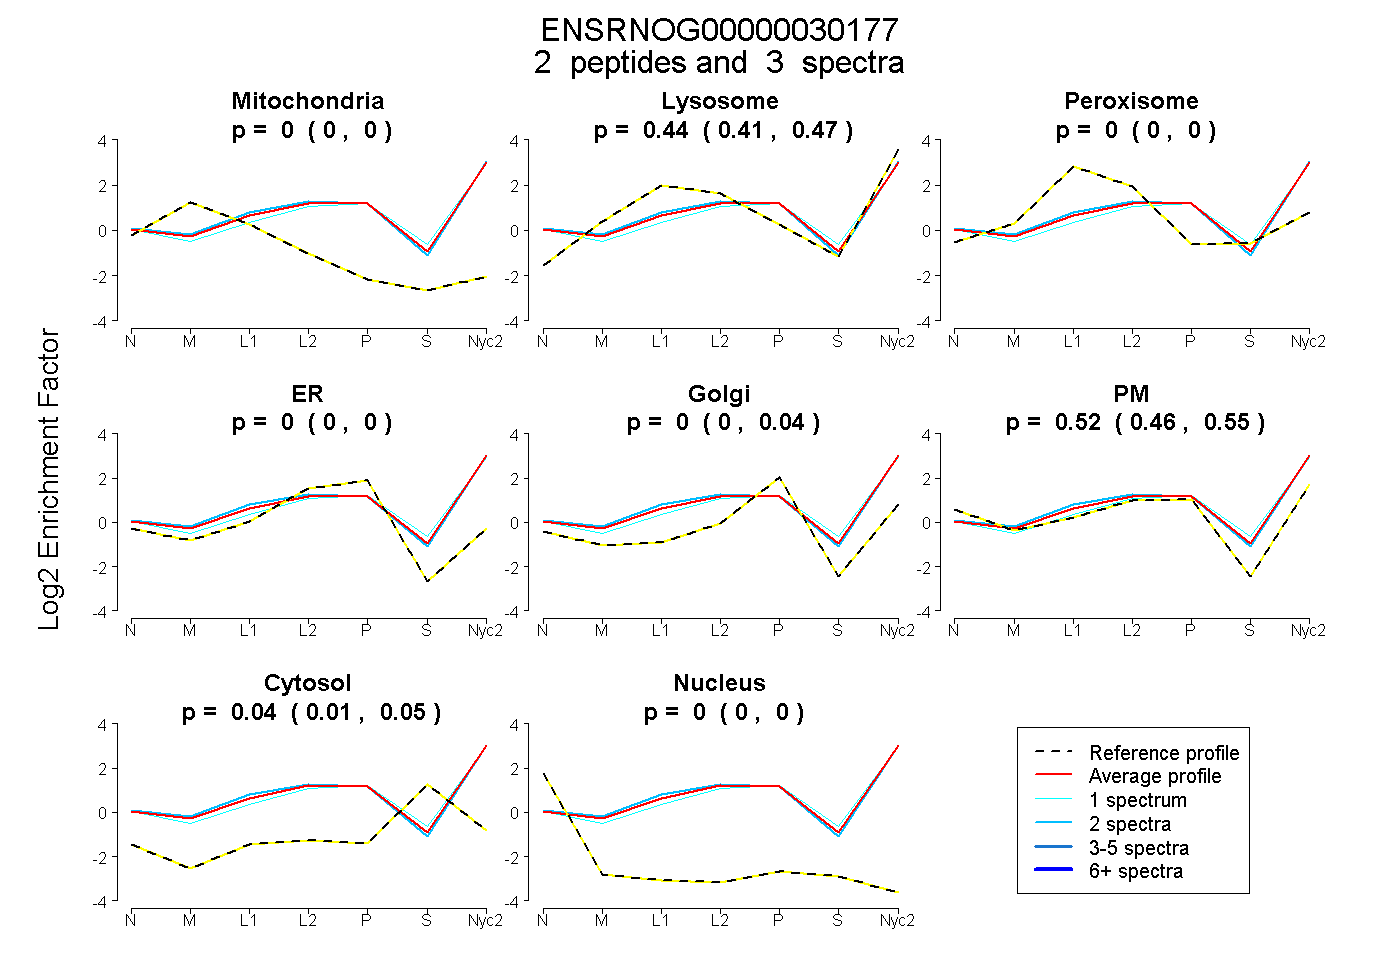
0.000 | 0.000
0.410 | 0.473
0.000 | 0.000
0.000 | 0.000
0.000 | 0.042
0.461 | 0.547
0.013 | 0.054
0.000 | 0.000
2peptides
spectra
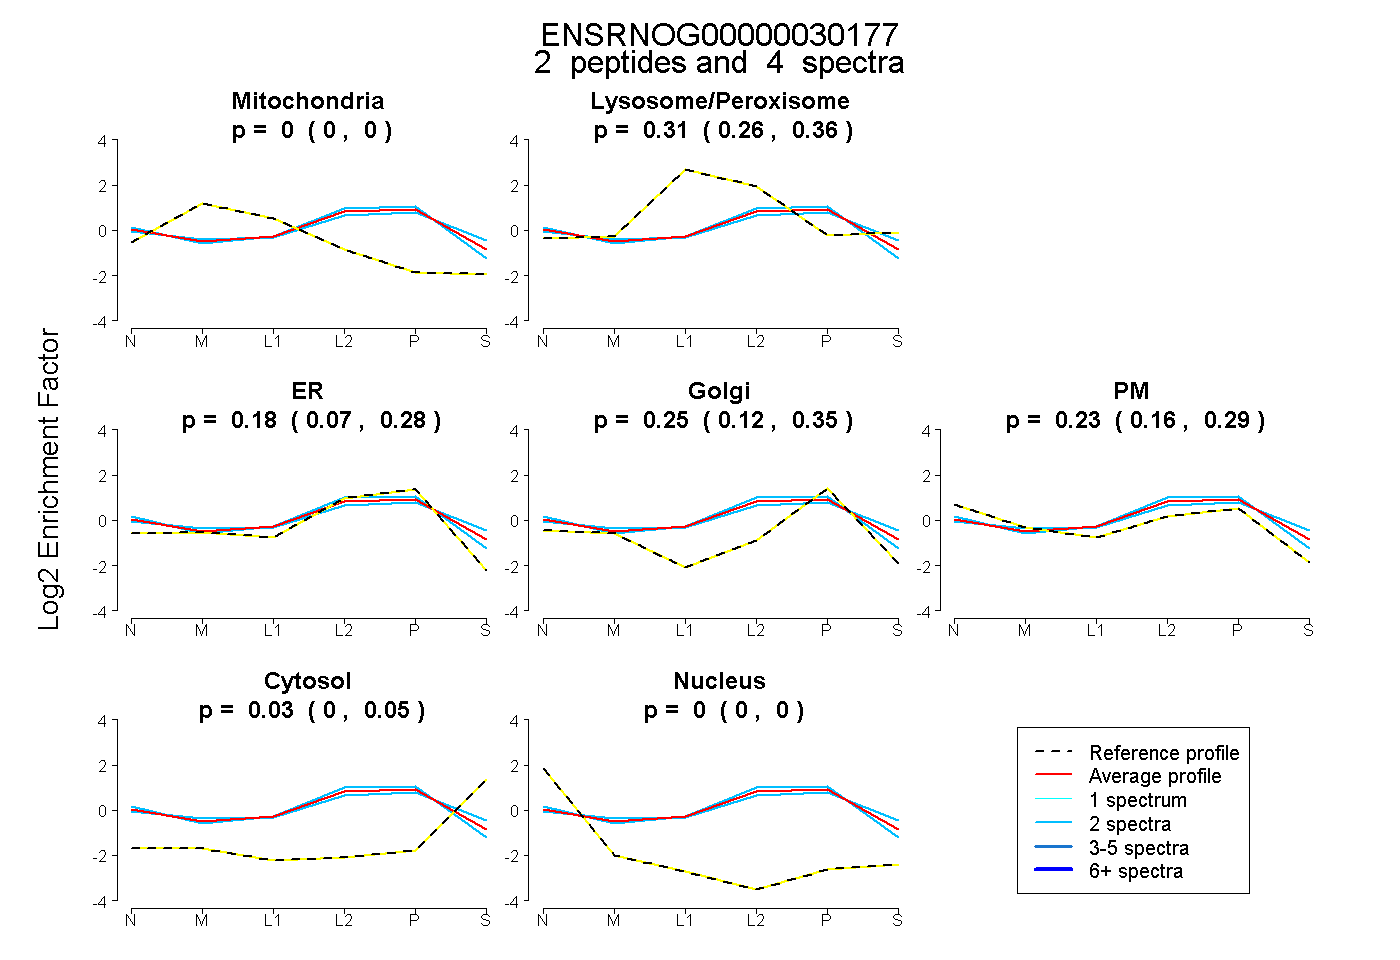
0.000 | 0.000
0.259 | 0.356
0.070 | 0.278
0.120 | 0.350
0.161 | 0.288
0.000 | 0.049
0.000 | 0.000
3peptides
spectra
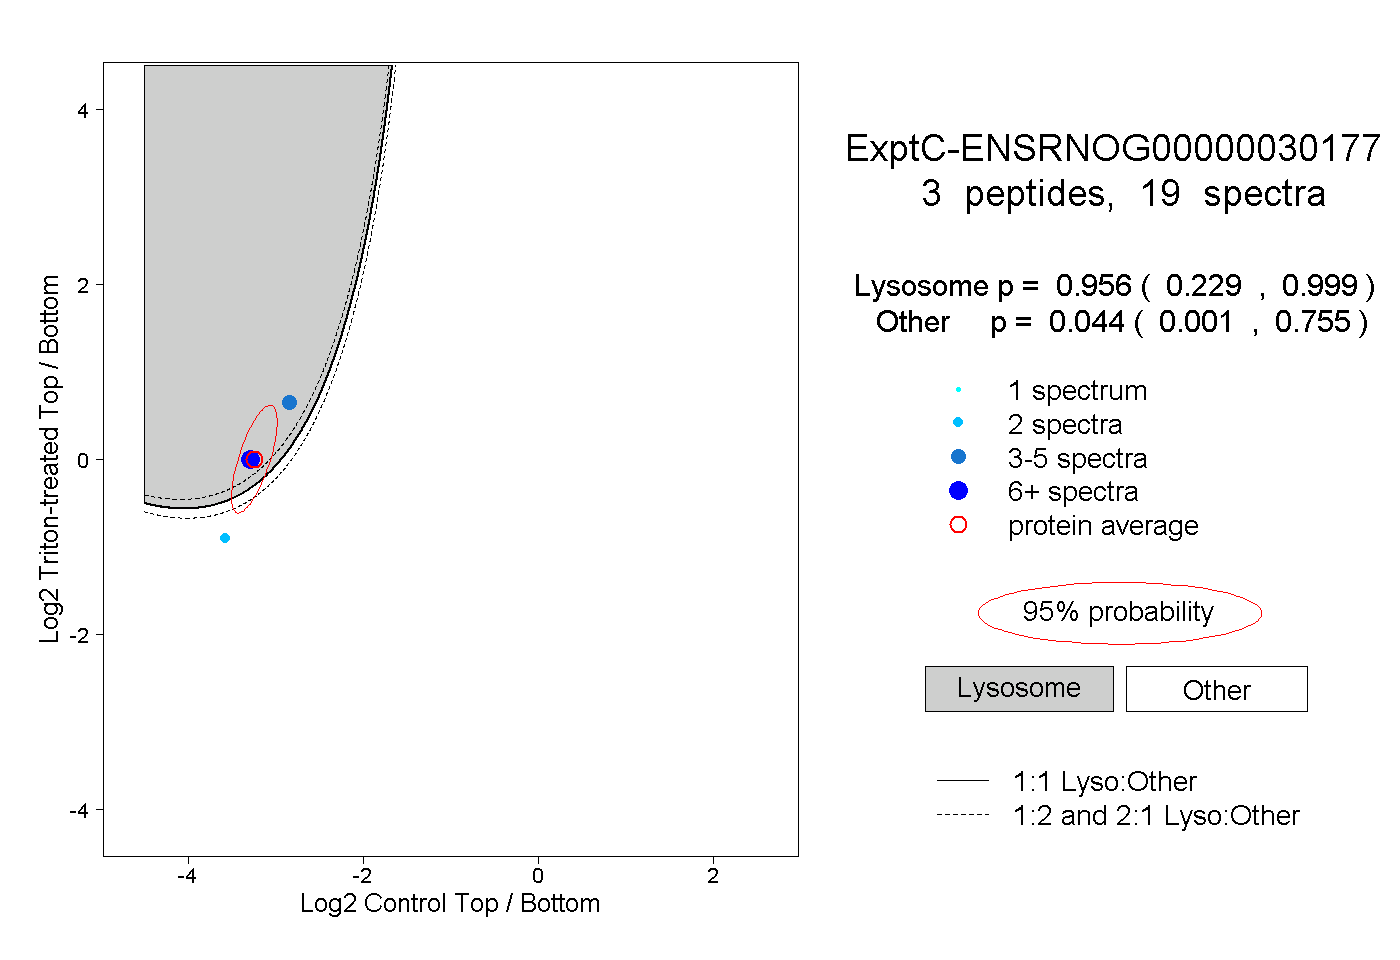
0.229 | 0.999
0.001 | 0.755
2peptides
spectra
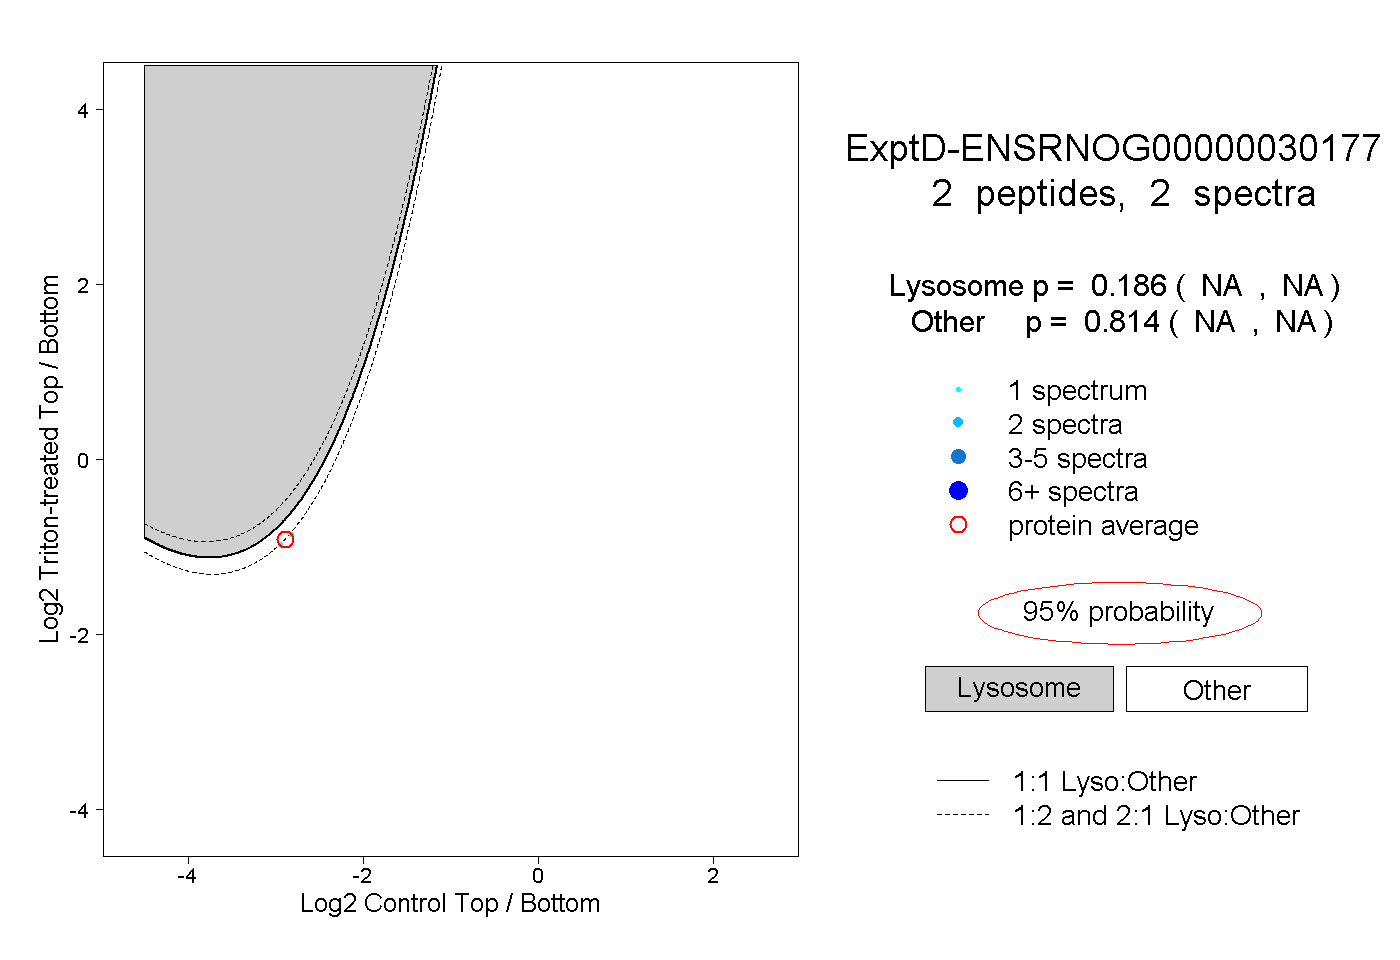
NA | NA
NA | NA