RPL36AL
[ENSRNOP00000049014]
Main page
| | | Plot |
Mito |
Lyso |
|
Perox |
ER |
Golgi |
PM |
Cytosol |
Nucleus |
|
| Expt A |
 7
7
peptides |
41
spectra |
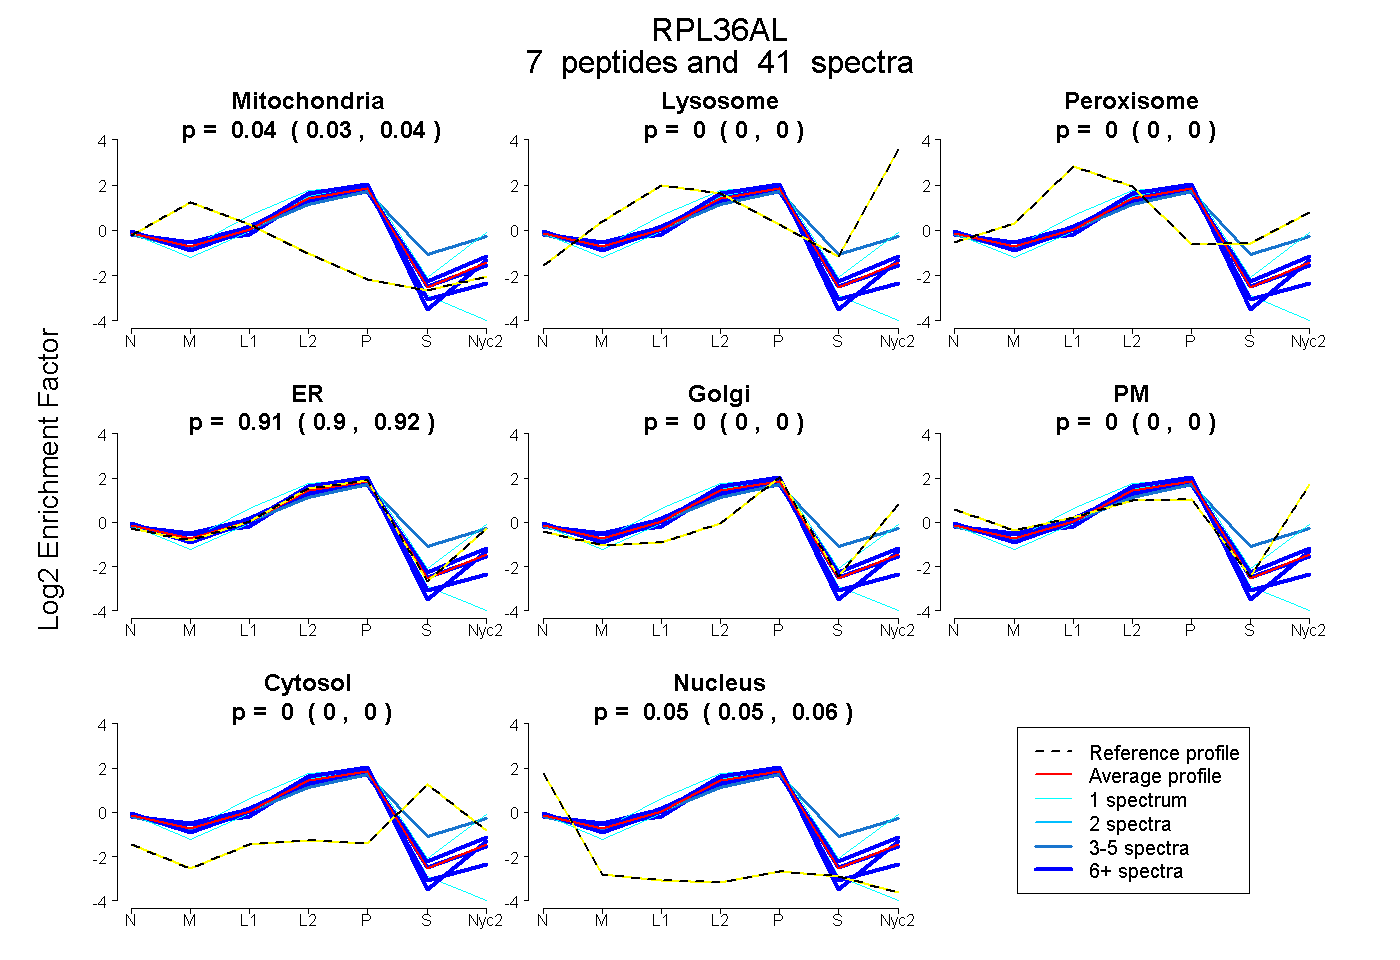 |
0.037
0.031 | 0.041 |
0.000
0.000 | 0.000 |
|
0.000
0.000 | 0.000 |
0.912
0.905 | 0.917 |
0.000
0.000 | 0.000 |
0.000
0.000 | 0.000 |
0.000
0.000 | 0.000 |
0.052
0.047 | 0.056 |
|
| | | Plot |
Mito |
|
Lyso or Perox |
|
ER |
Golgi |
PM |
Cytosol |
Nucleus |
|
| Expt B |
4
peptides |
11
spectra |
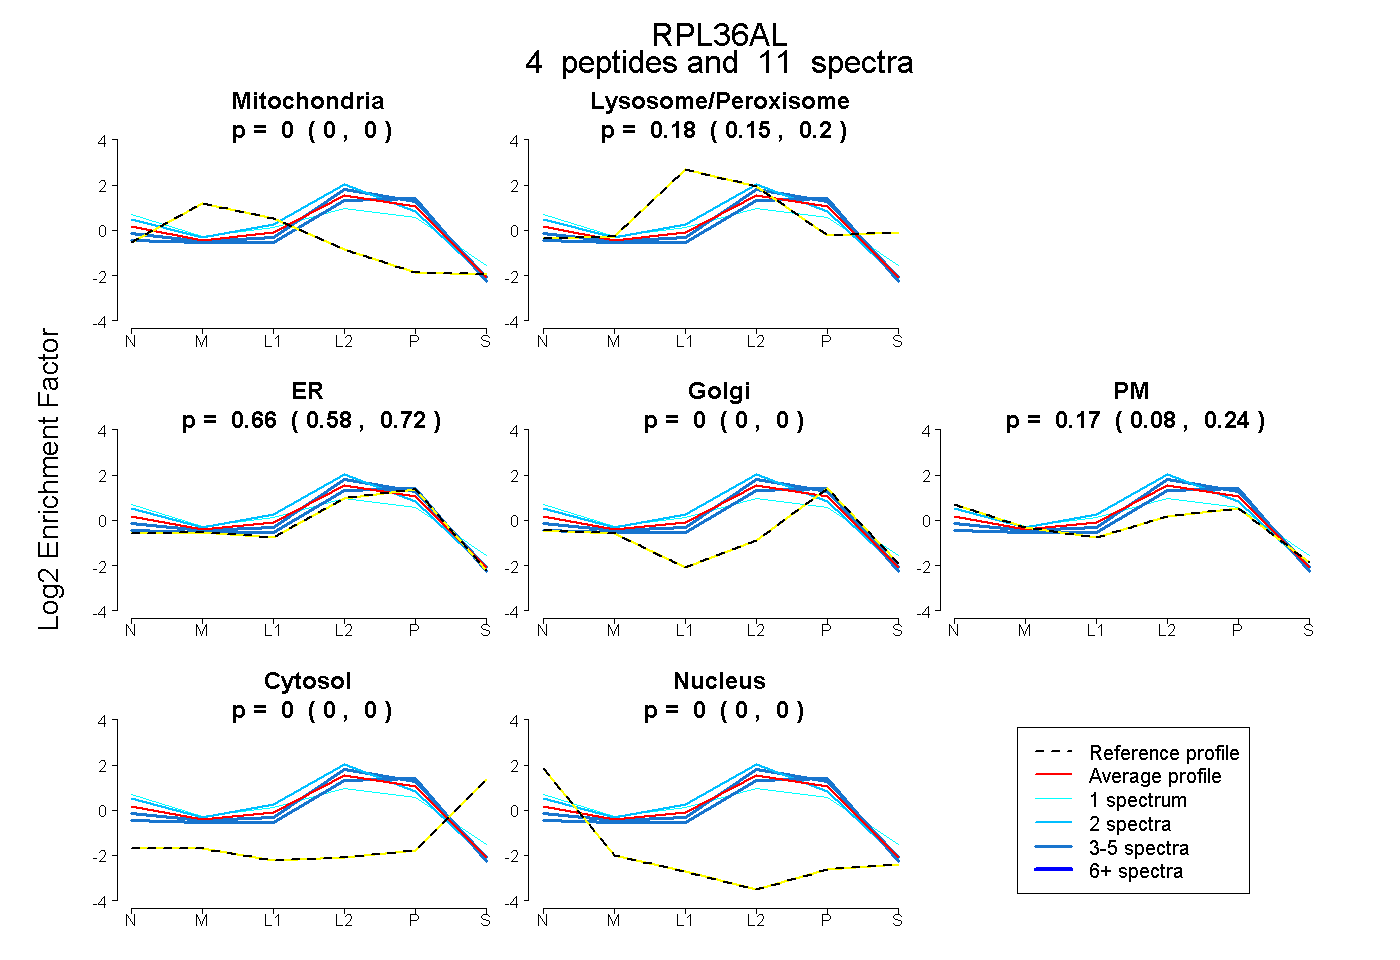 |
0.000
0.000 | 0.000 |
|
0.175
0.149 | 0.198 |
|
0.655
0.577 | 0.719 |
0.000
0.000 | 0.000 |
0.169
0.085 | 0.238 |
0.000
0.000 | 0.000 |
0.000
0.000 | 0.000 |
|
| | | Plot |
|
Lyso |
|
|
|
|
|
|
|
Other |
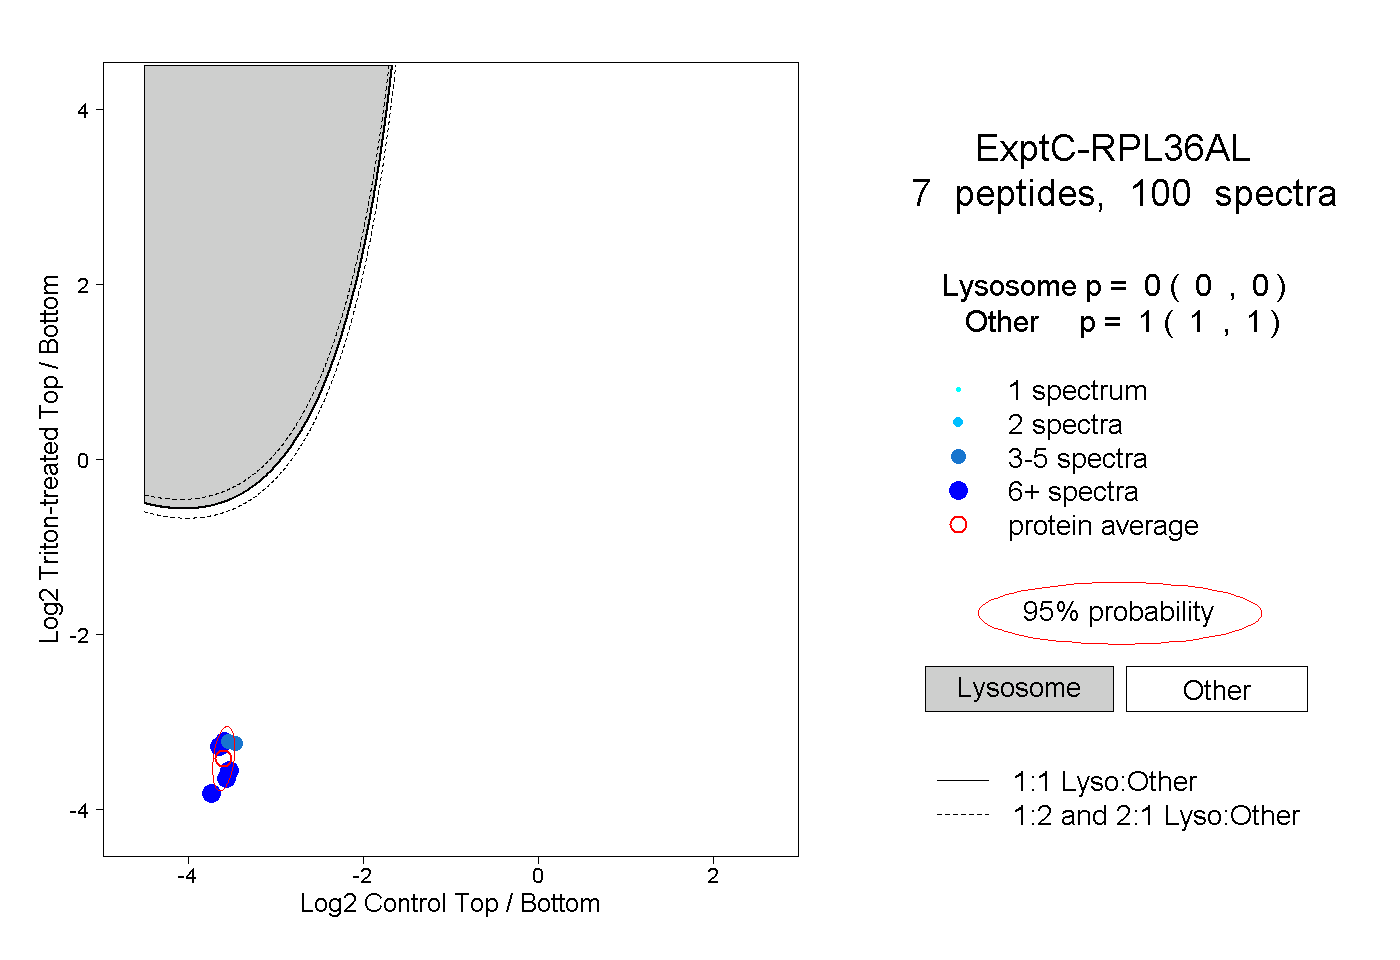
| Expt C |
7
peptides |
100
spectra |
 |
|
0.000
0.000 | 0.000 |
|
|
|
|
|
|
|
1.000
1.000 | 1.000 |
| 10 spectra, DSLYAQGK |
|
0.000 |
|
|
|
|
|
|
|
1.000 |
| 16 spectra, HFELGGDK |
|
0.000 |
|
|
|
|
|
|
|
1.000 |
| 27 spectra, LECVEPNCR |
|
0.000 |
|
|
|
|
|
|
|
1.000 |
| 32 spectra, VNVPK |
|
0.000 |
|
|
|
|
|
|
|
1.000 |
| 8 spectra, MLALK |
|
0.000 |
|
|
|
|
|
|
|
1.000 |
| 4 spectra, VTQYK |
|
0.000 |
|
|
|
|
|
|
|
1.000 |
| 3 spectra, QSGYGGQTKPIFR |
|
0.000 |
|
|
|
|
|
|
|
1.000 |
| | | Plot |
|
Lyso |
|
|
|
|
|
|
|
Other |
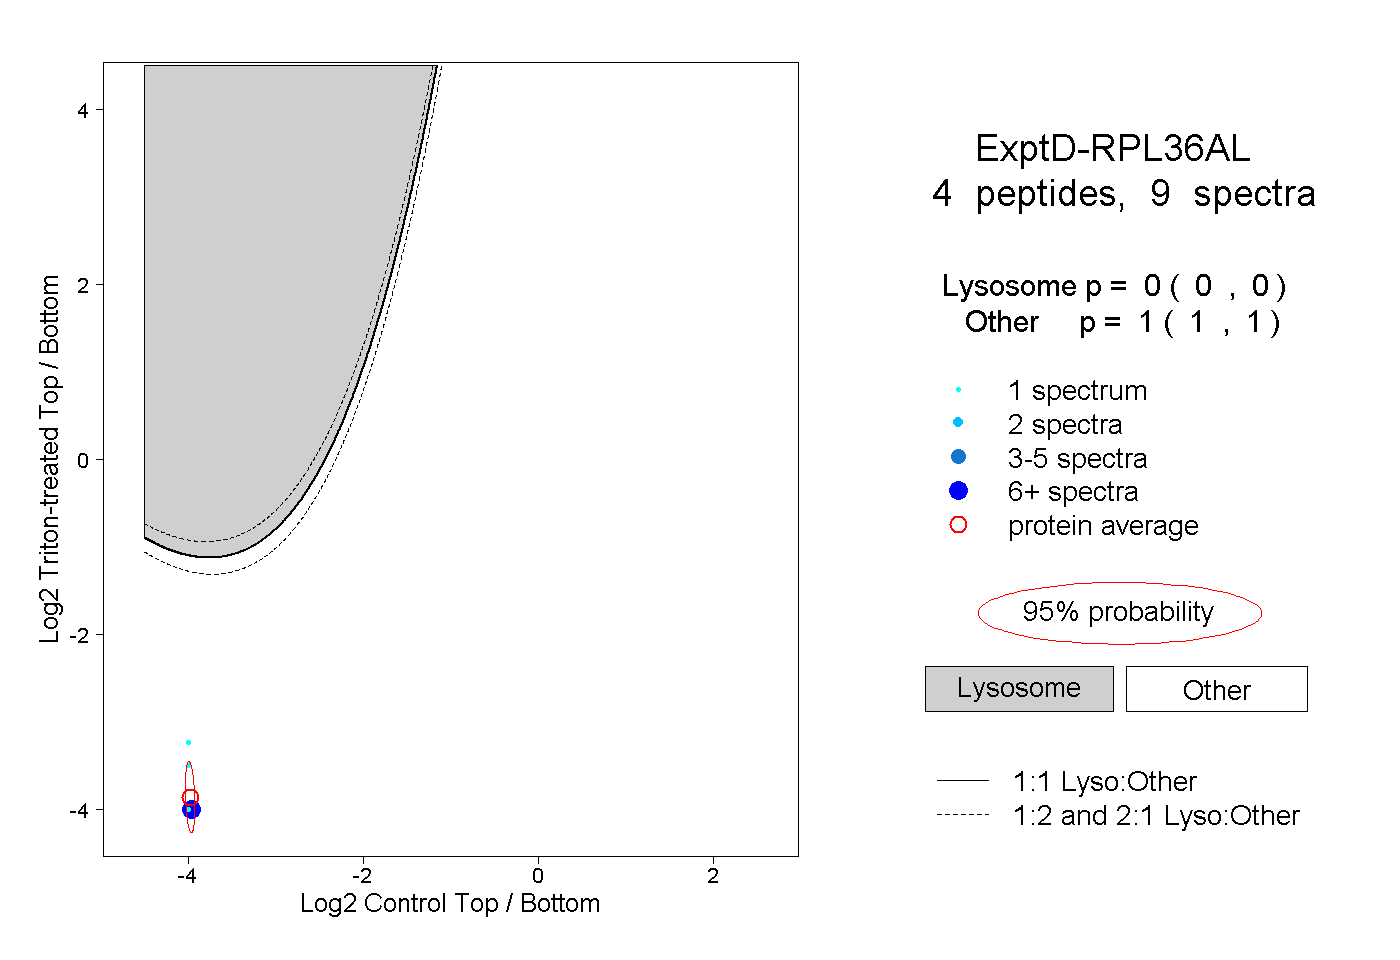
| Expt D |
4
peptides |
9
spectra |
 |
|
0.000
0.000 | 0.000 |
|
|
|
|
|
|
|
1.000
1.000 | 1.000 |