 6
6peptides
spectra
0.000 | 0.000
0.085 | 0.216
0.000 | 0.000
0.000 | 0.000
0.000 | 0.000
0.060 | 0.204
0.186 | 0.248
0.447 | 0.517
3peptides
spectra

0.000 | 0.998
0.002 | 1.000
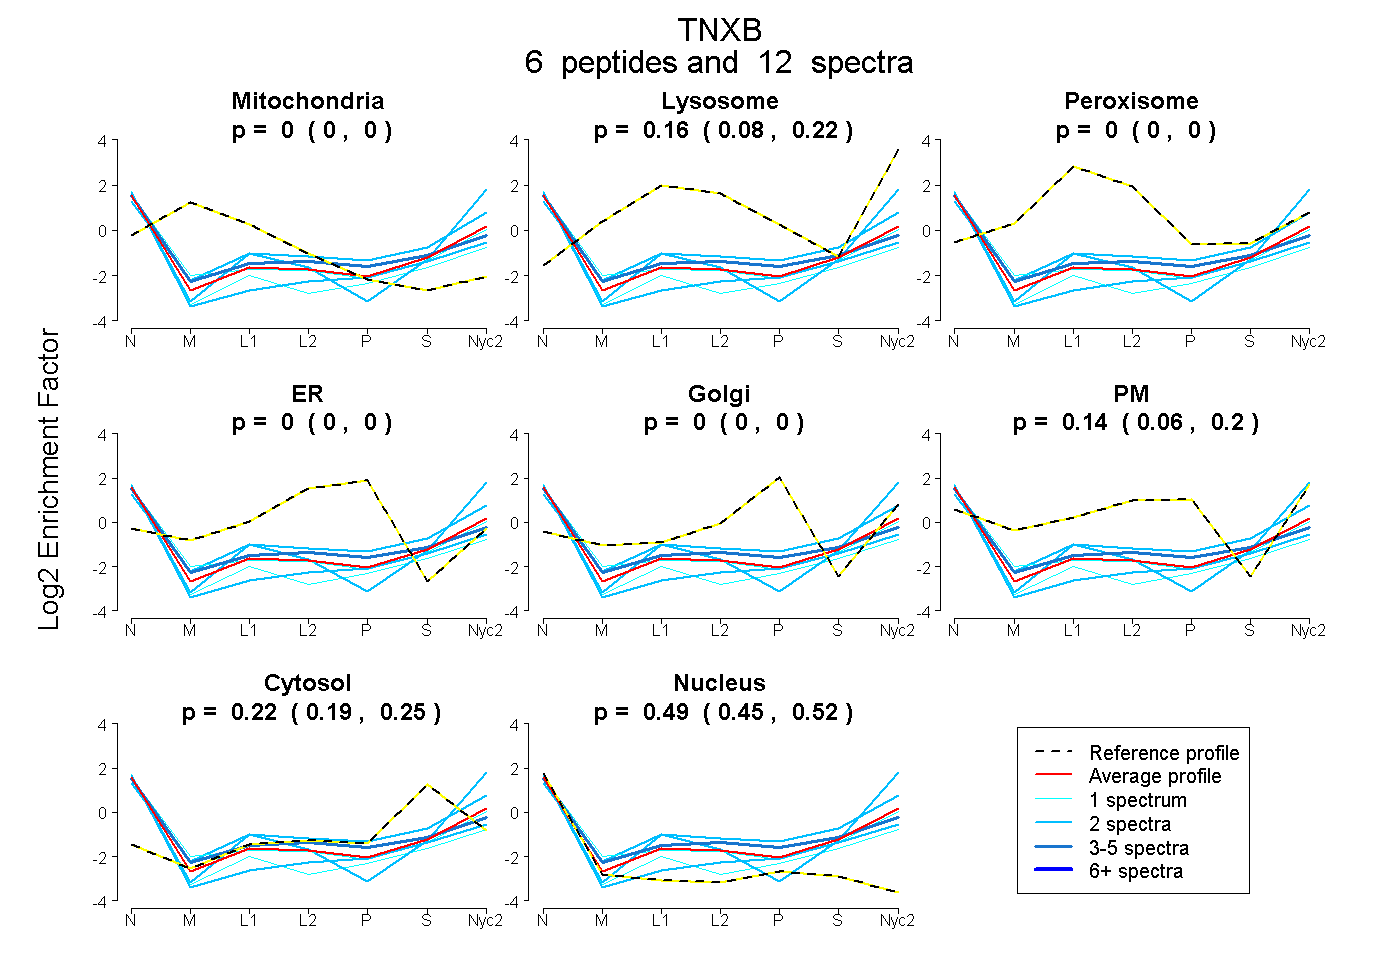
| Plot | Mito | Lyso | Perox | ER | Golgi | PM | Cytosol | Nucleus | |||||
| Expt A |
6 peptides |
12 spectra |
|
0.000 0.000 | 0.000 |
0.159 0.085 | 0.216 |
0.000 0.000 | 0.000 |
0.000 0.000 | 0.000 |
0.000 0.000 | 0.000 |
0.137 0.060 | 0.204 |
0.218 0.186 | 0.248 |
0.486 0.447 | 0.517 |
||
| Plot | Lyso | Other | |||||||||||
| Expt C |
3 peptides |
5 spectra |
|
0.238 0.000 | 0.998 |
0.762 0.002 | 1.000 |