27
27peptides
spectra
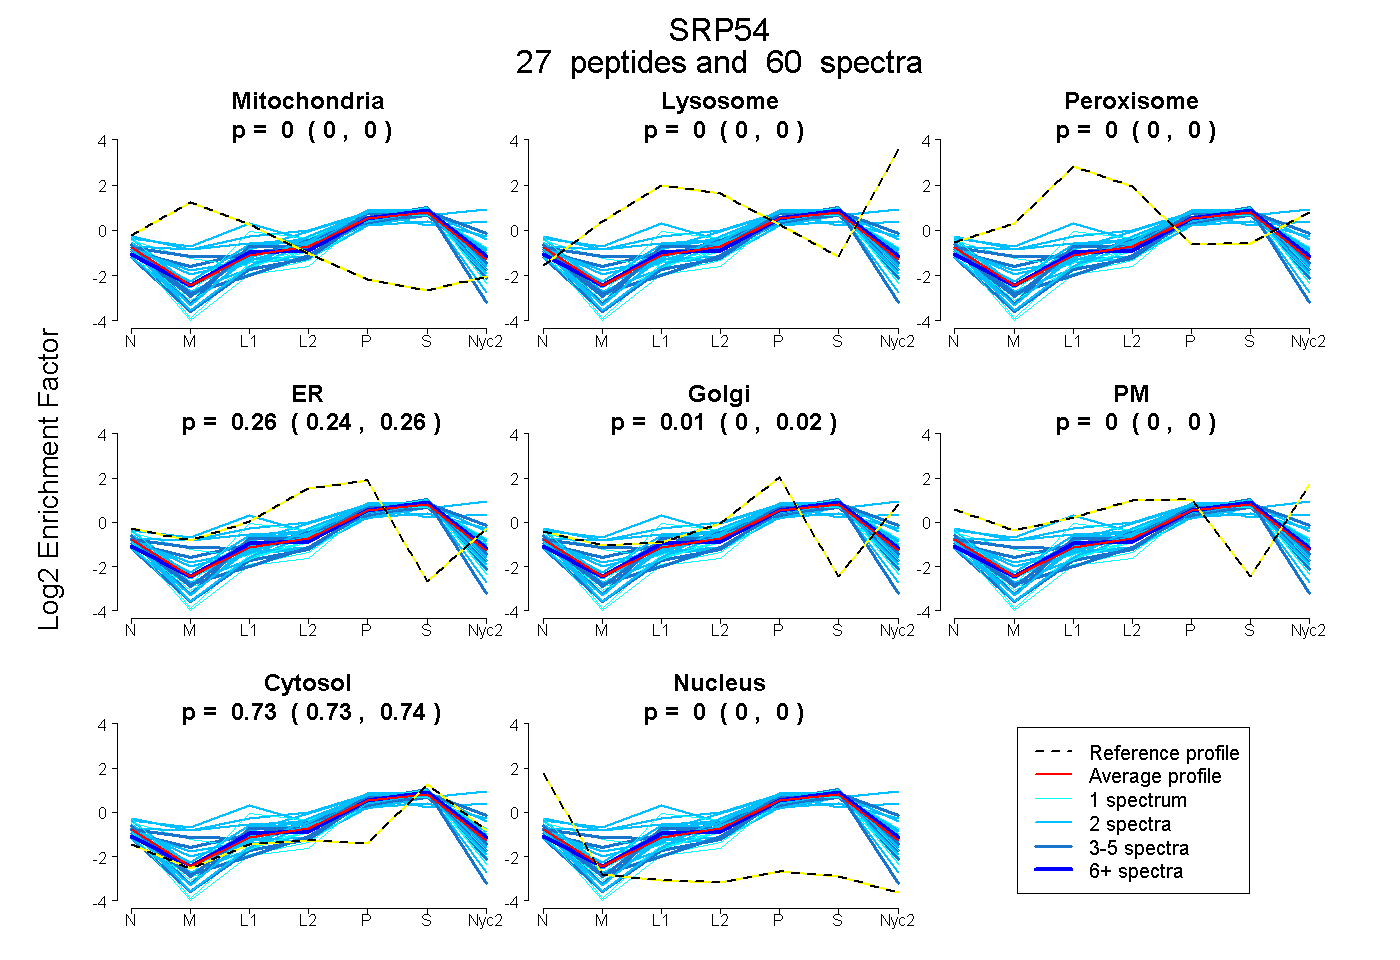
0.000 | 0.000
0.000 | 0.000
0.000 | 0.000
0.242 | 0.265
0.000 | 0.024
0.000 | 0.000
0.730 | 0.737
0.000 | 0.000
10peptides
spectra
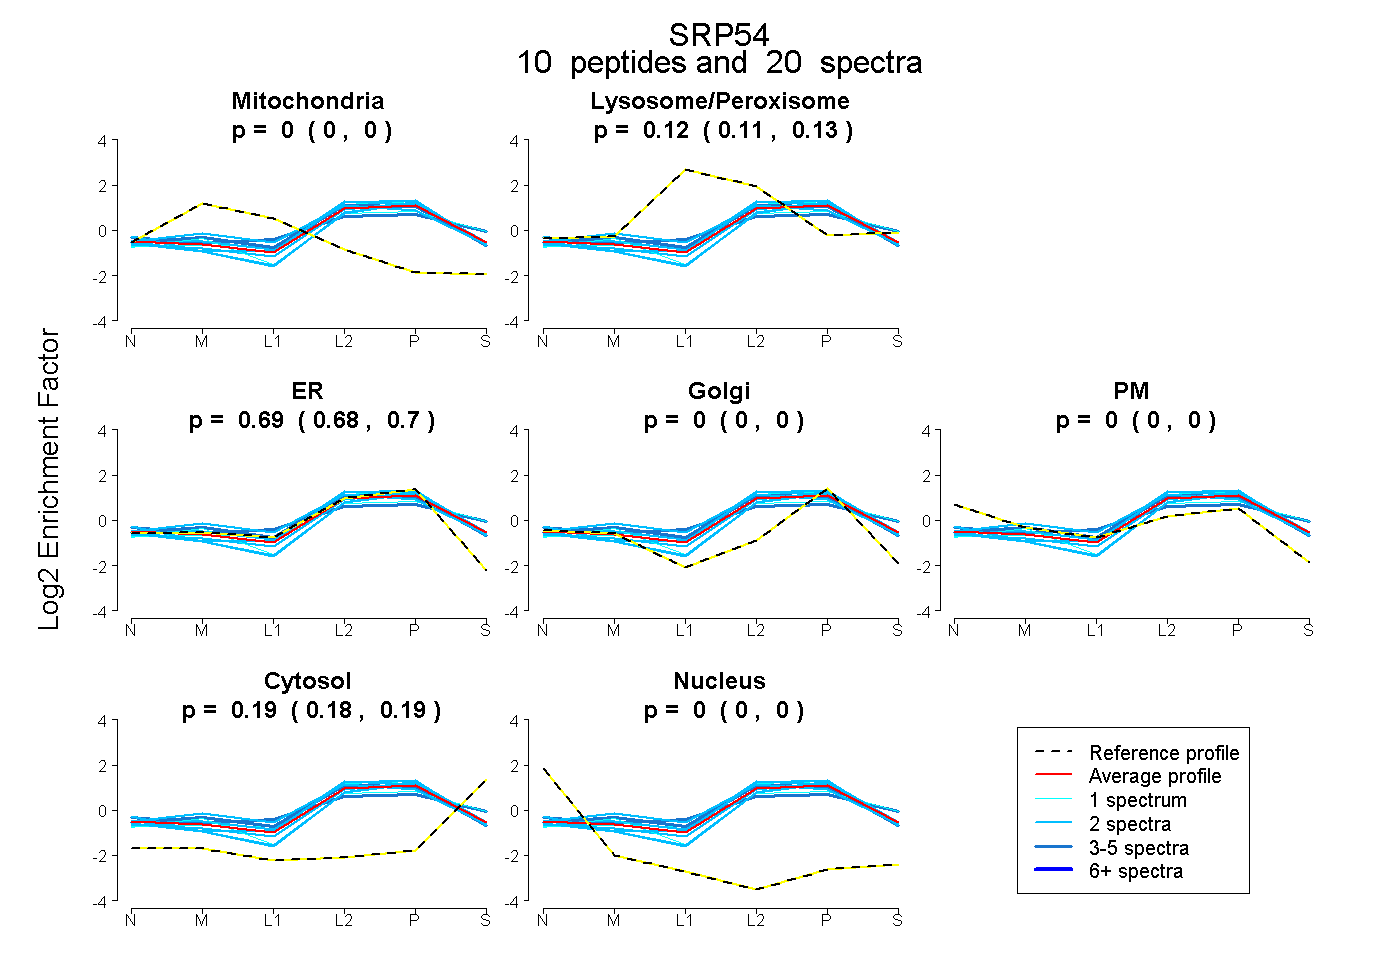
0.000 | 0.000
0.112 | 0.134
0.680 | 0.700
0.000 | 0.000
0.000 | 0.000
0.179 | 0.191
0.000 | 0.000