 4
4peptides
spectra
0.000 | 0.070
0.000 | 0.000
0.000 | 0.058
0.306 | 0.396
0.000 | 0.000
0.000 | 0.000
0.260 | 0.335
0.263 | 0.355
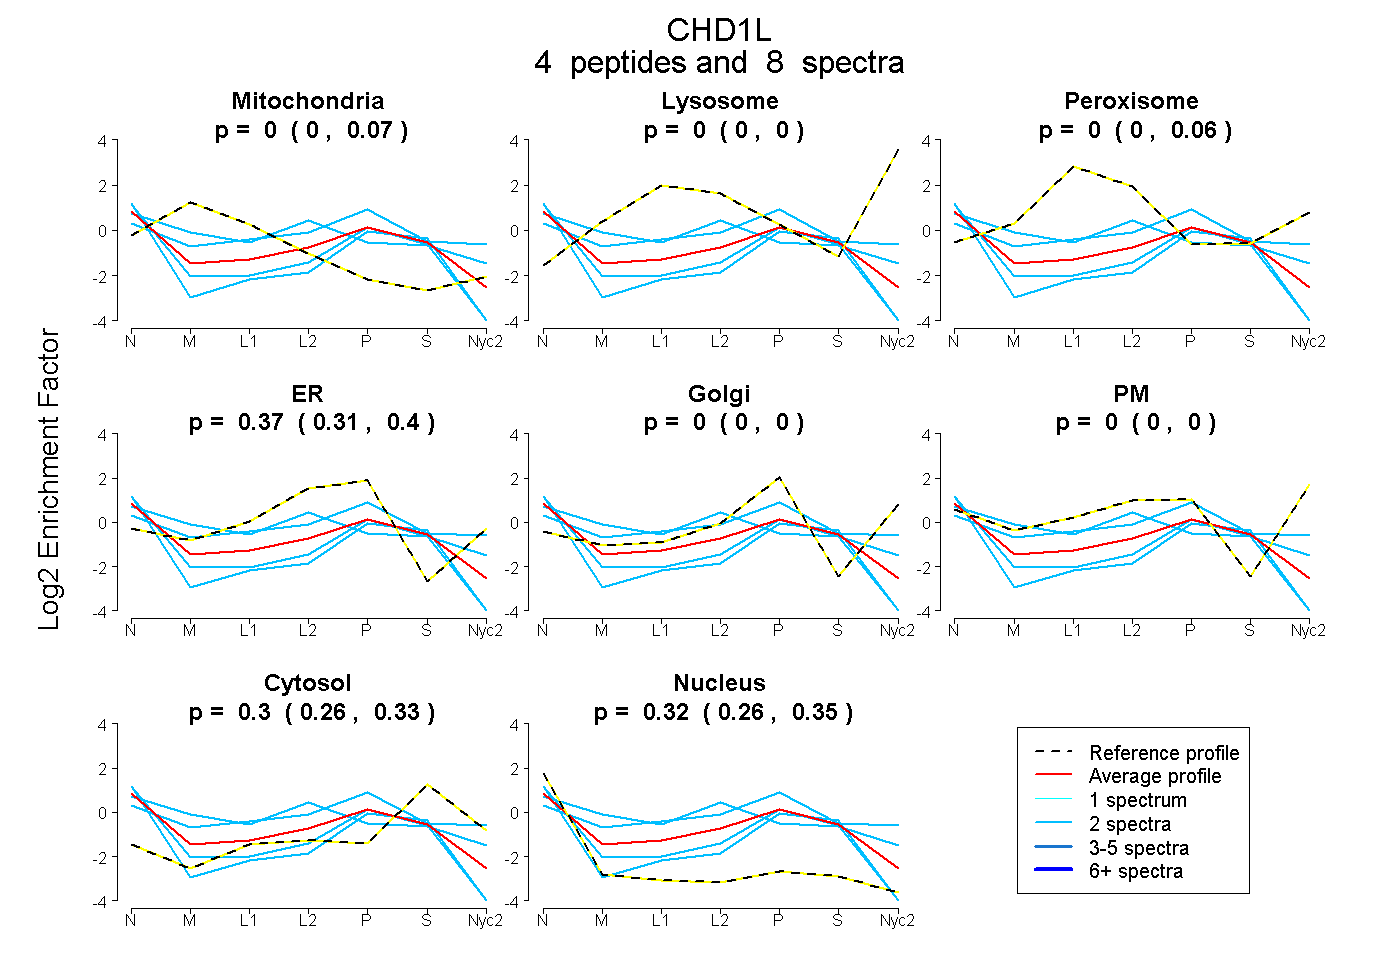
| Plot | Mito | Lyso | Perox | ER | Golgi | PM | Cytosol | Nucleus | |||||
| Expt A |
4 peptides |
8 spectra |
|
0.000 0.000 | 0.070 |
0.000 0.000 | 0.000 |
0.004 0.000 | 0.058 |
0.371 0.306 | 0.396 |
0.000 0.000 | 0.000 |
0.000 0.000 | 0.000 |
0.305 0.260 | 0.335 |
0.320 0.263 | 0.355 |
| 2 spectra, ILSPEELEDR | 0.000 | 0.000 | 0.000 | 0.244 | 0.000 | 0.000 | 0.231 | 0.525 | ||
| 2 spectra, MAGGSPR | 0.166 | 0.000 | 0.257 | 0.238 | 0.000 | 0.000 | 0.160 | 0.179 | ||
| 2 spectra, DLDAFENETAK | 0.020 | 0.000 | 0.136 | 0.264 | 0.226 | 0.018 | 0.274 | 0.061 | ||
| 2 spectra, LHLLDR | 0.000 | 0.000 | 0.000 | 0.125 | 0.000 | 0.000 | 0.319 | 0.557 |
| Plot | Lyso | Other | |||||||||||
| Expt C |
2 peptides |
2 spectra |
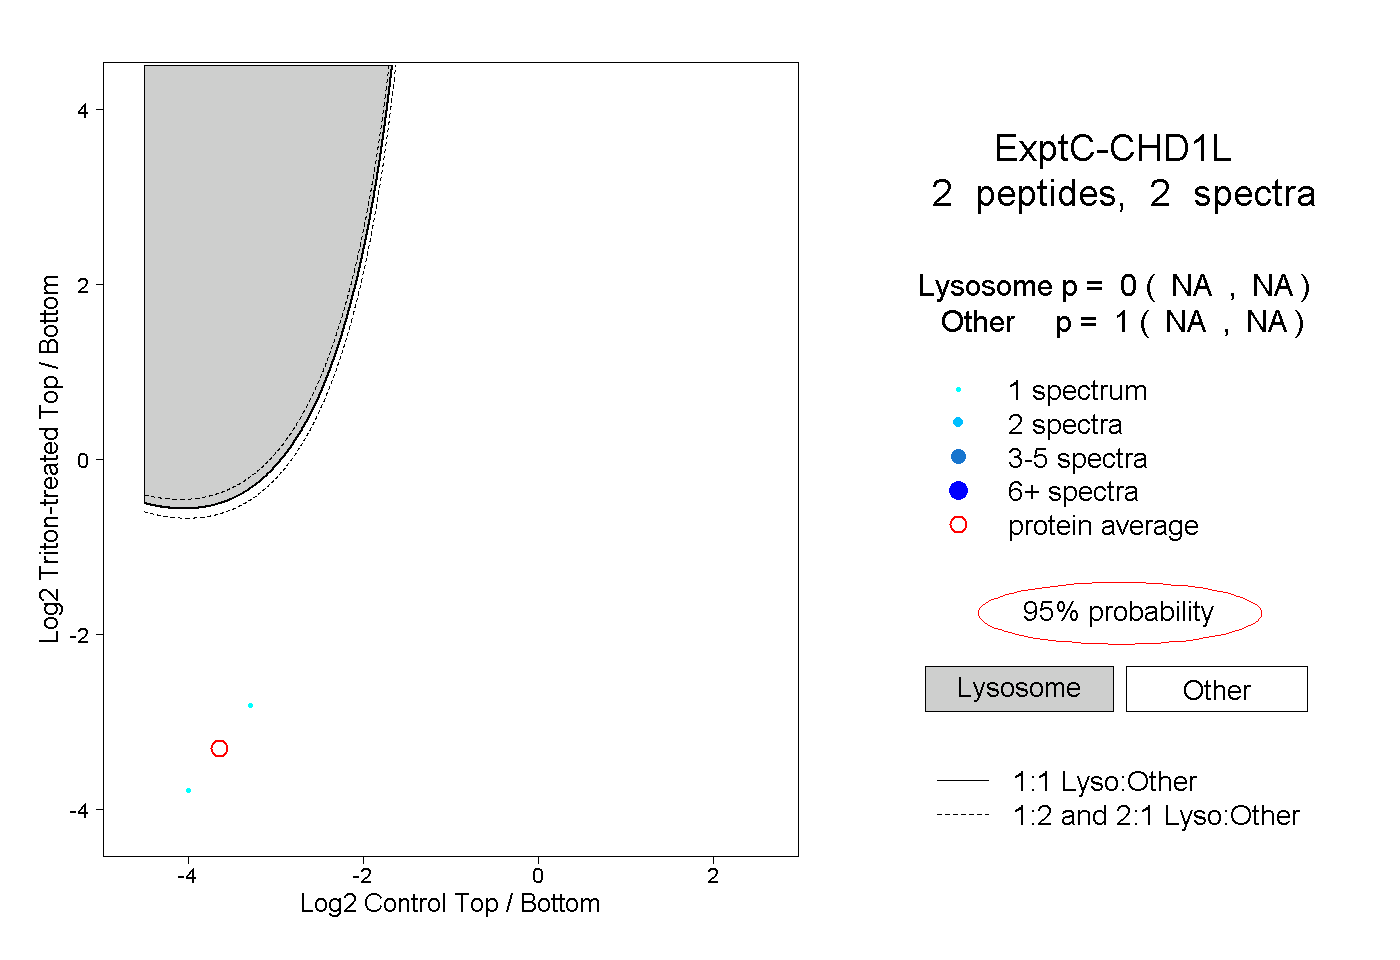 |
0.000 NA | NA |
1.000 NA | NA |