 6
6peptides
spectra
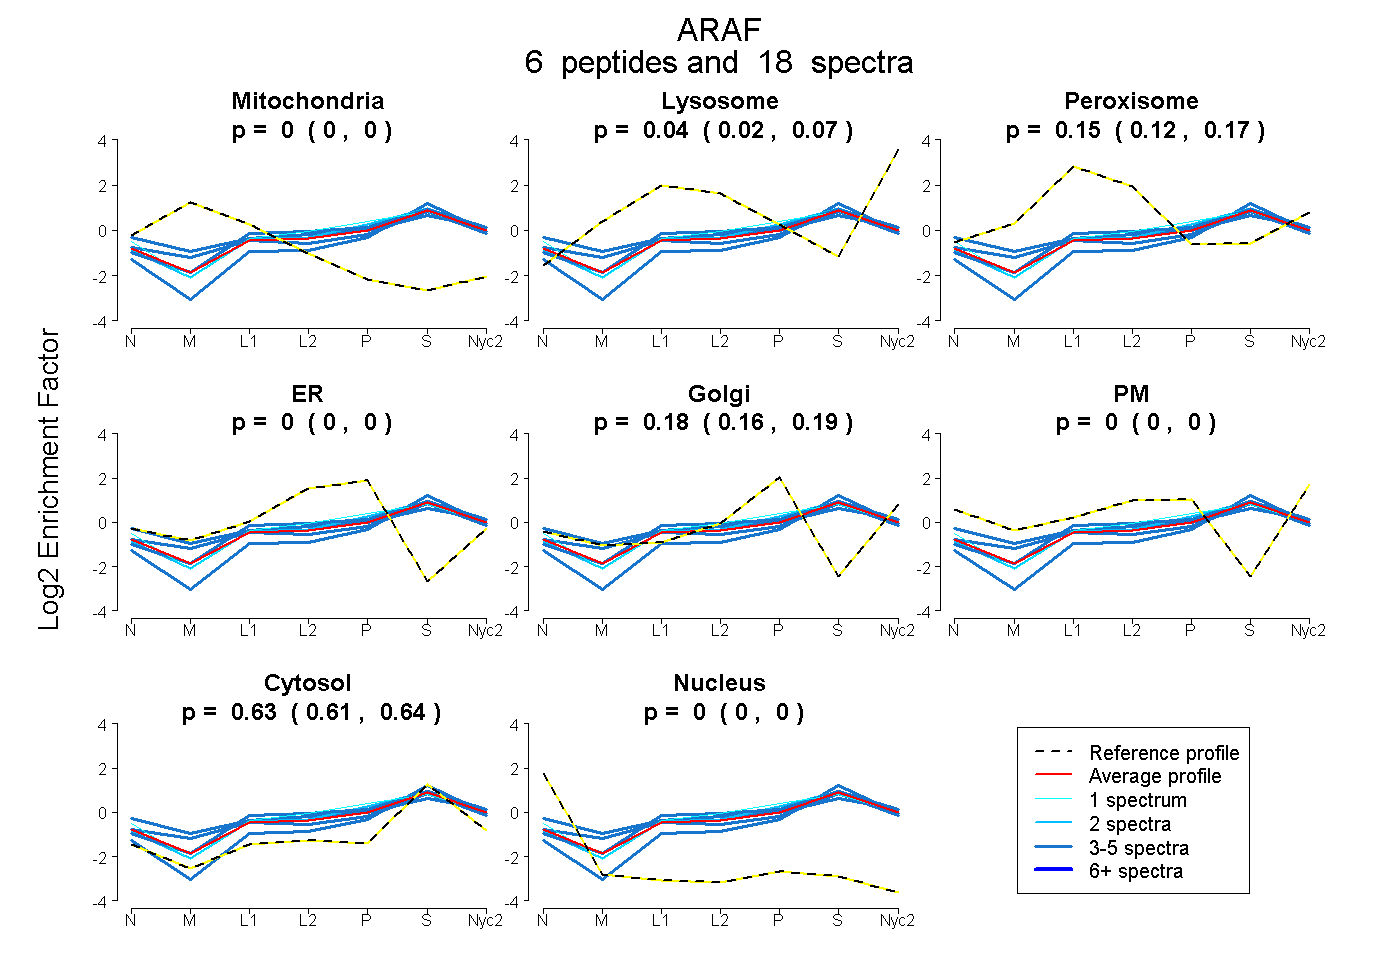
0.000 | 0.000
0.019 | 0.066
0.121 | 0.170
0.000 | 0.000
0.164 | 0.190
0.000 | 0.000
0.615 | 0.640
0.000 | 0.000
3peptides
spectra
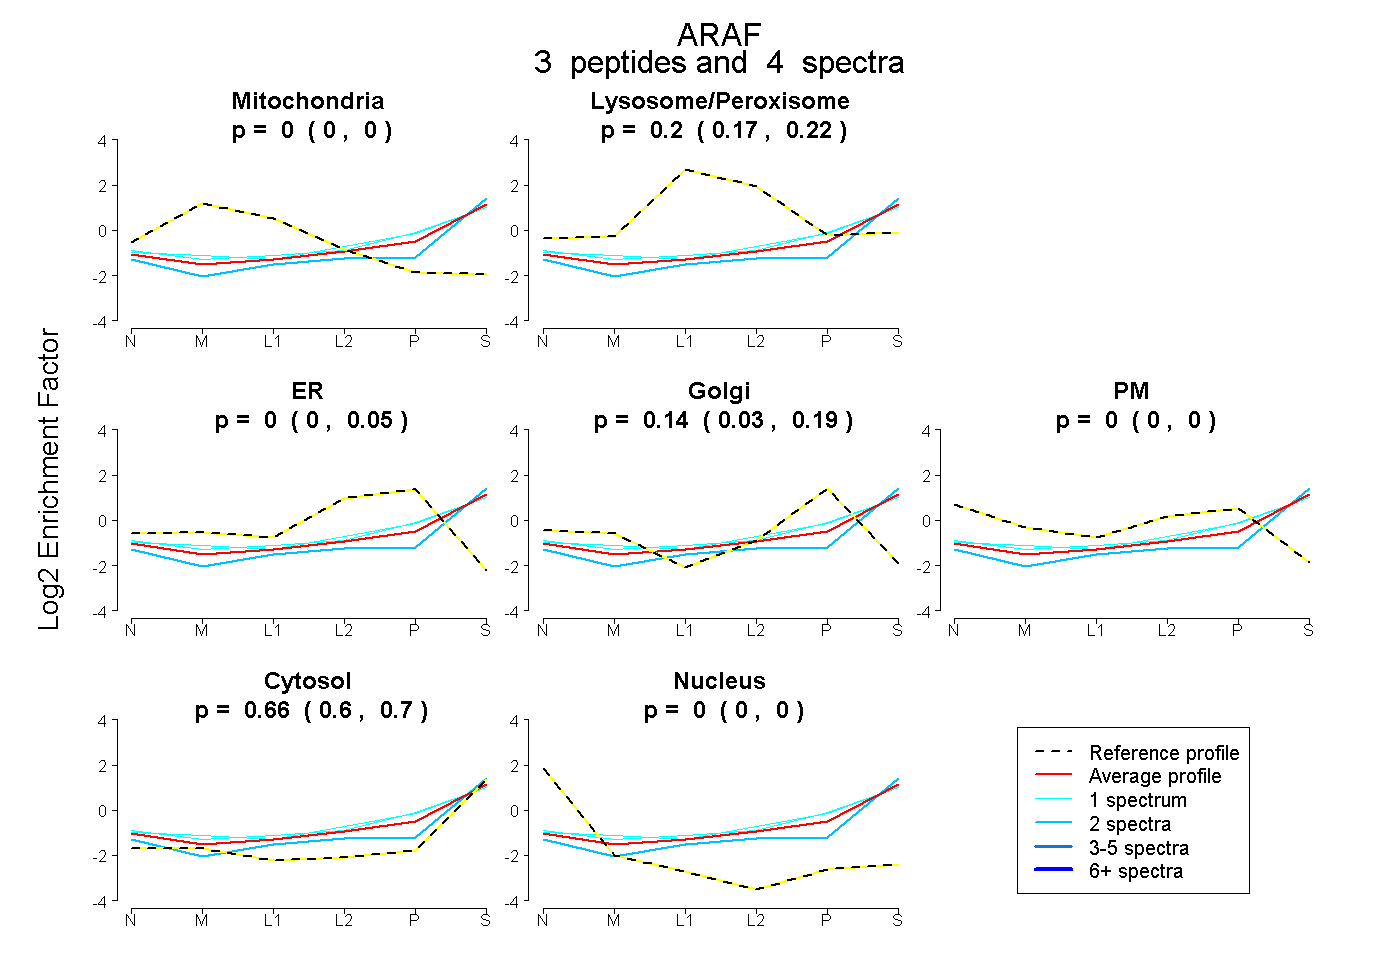
0.000 | 0.000
0.172 | 0.222
0.000 | 0.047
0.028 | 0.188
0.000 | 0.000
0.604 | 0.704
0.000 | 0.000
5peptides
spectra
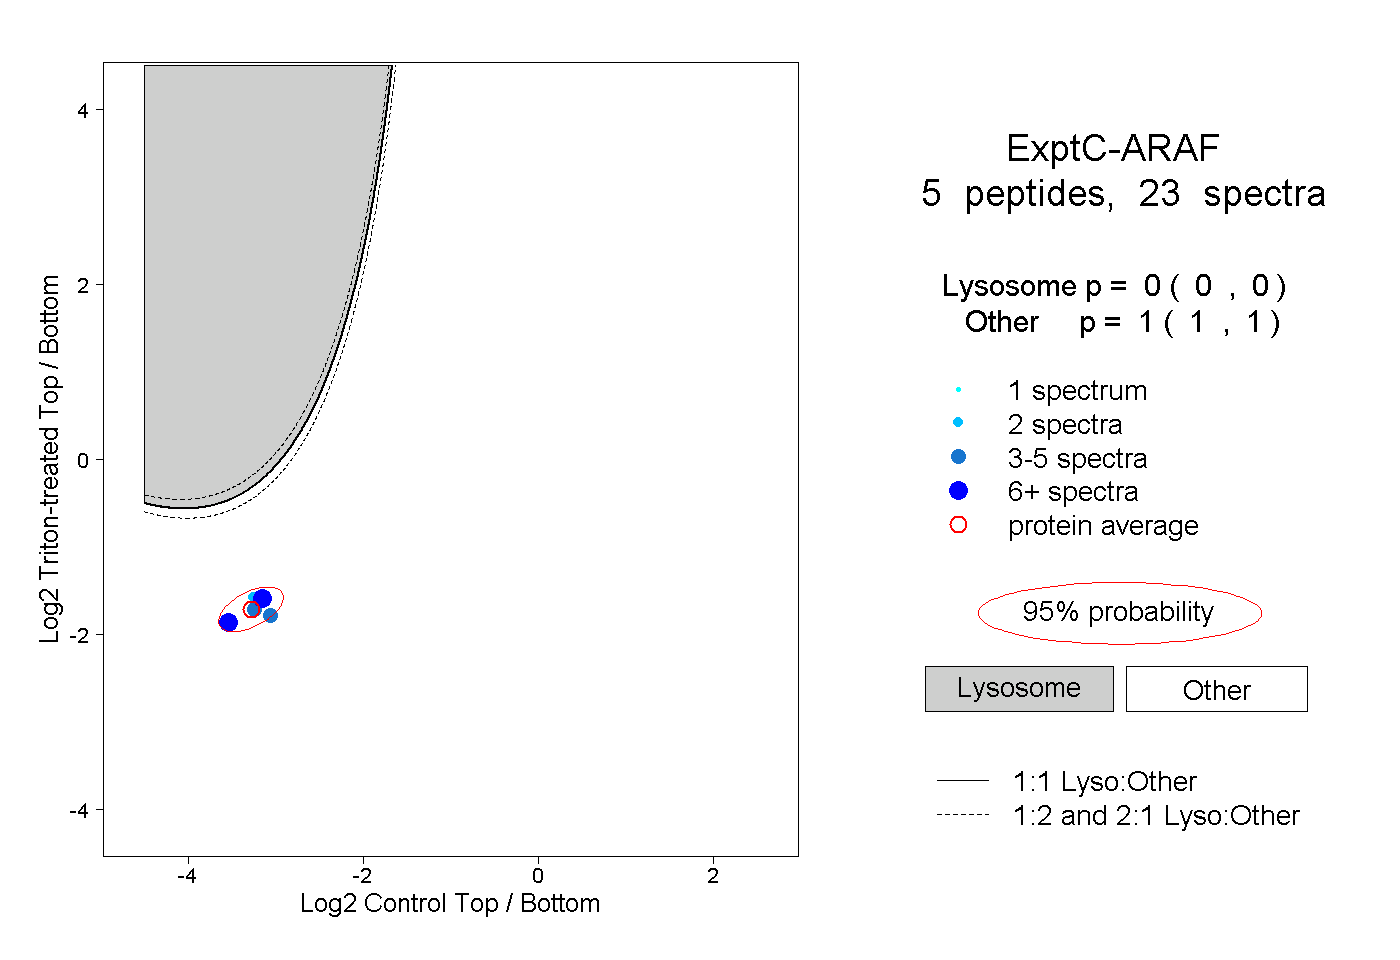
0.000 | 0.000
1.000 | 1.000