 2
2peptides
spectra
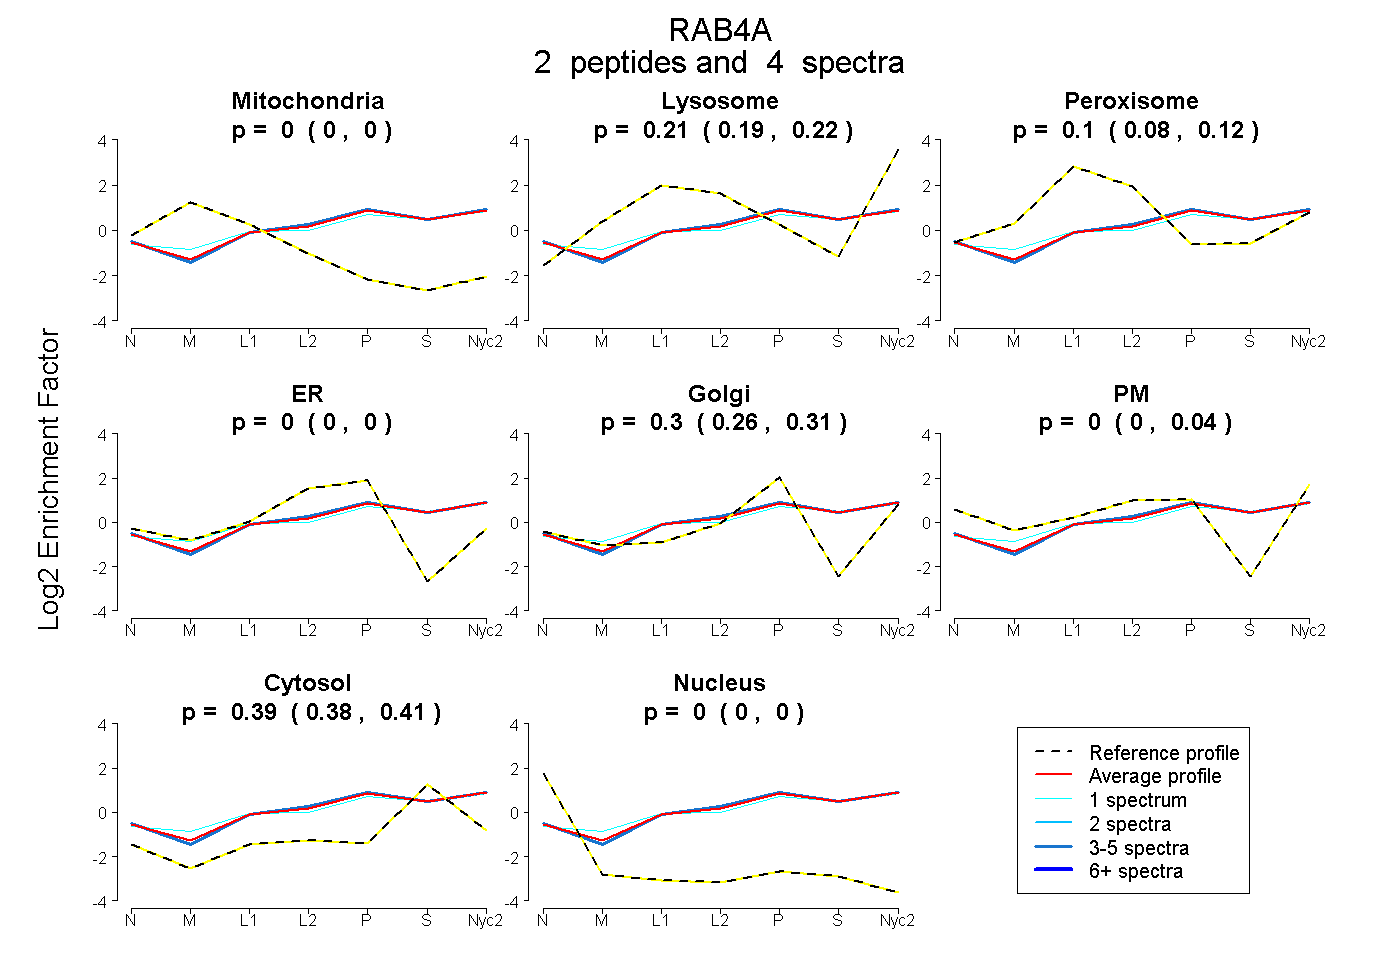
0.000 | 0.000
0.187 | 0.219
0.079 | 0.120
0.000 | 0.000
0.261 | 0.309
0.000 | 0.036
0.376 | 0.409
0.000 | 0.000
1peptide
spectra

0.000 | 0.000
0.332 | 0.356
0.021 | 0.092
0.291 | 0.355
0.000 | 0.000
0.259 | 0.277
0.000 | 0.000
2peptides
spectra
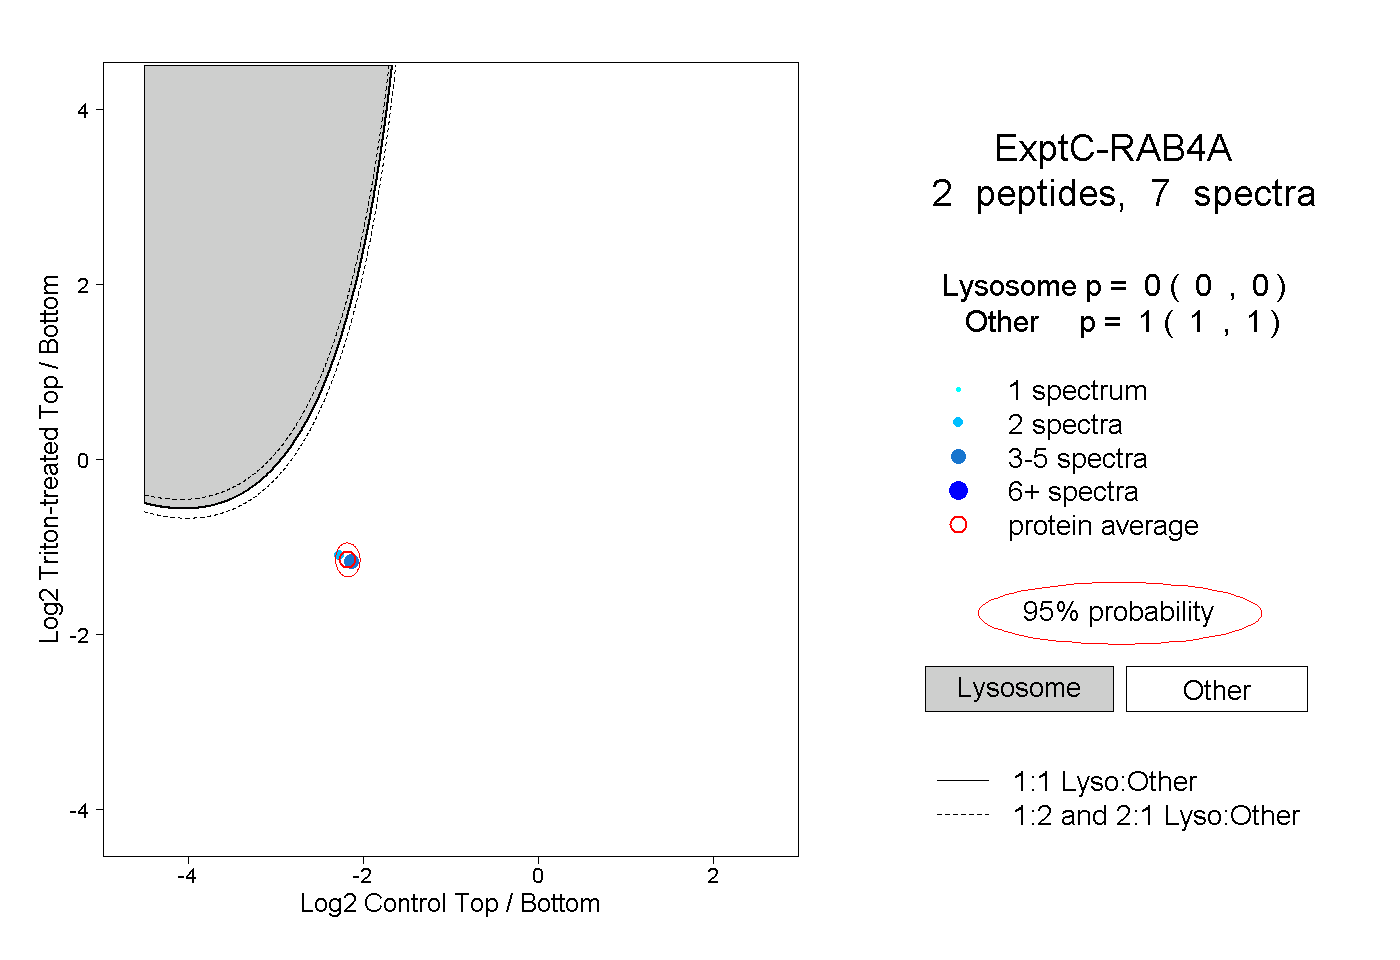
0.000 | 0.000
1.000 | 1.000