57
57peptides
spectra
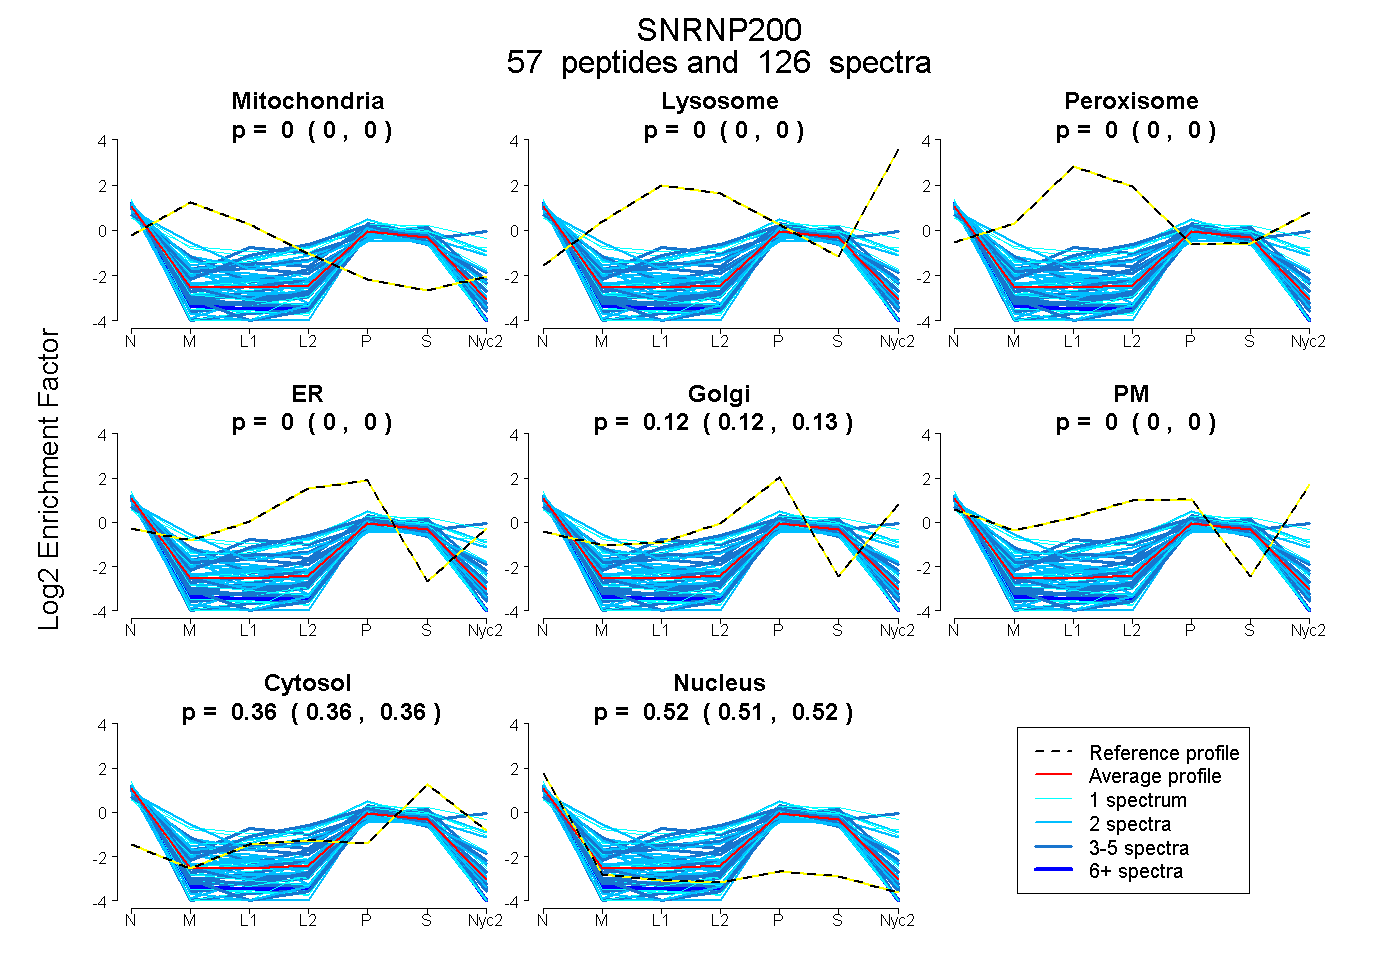
0.000 | 0.000
0.000 | 0.000
0.000 | 0.000
0.000 | 0.000
0.122 | 0.126
0.000 | 0.000
0.358 | 0.361
0.514 | 0.518
12peptides
spectra
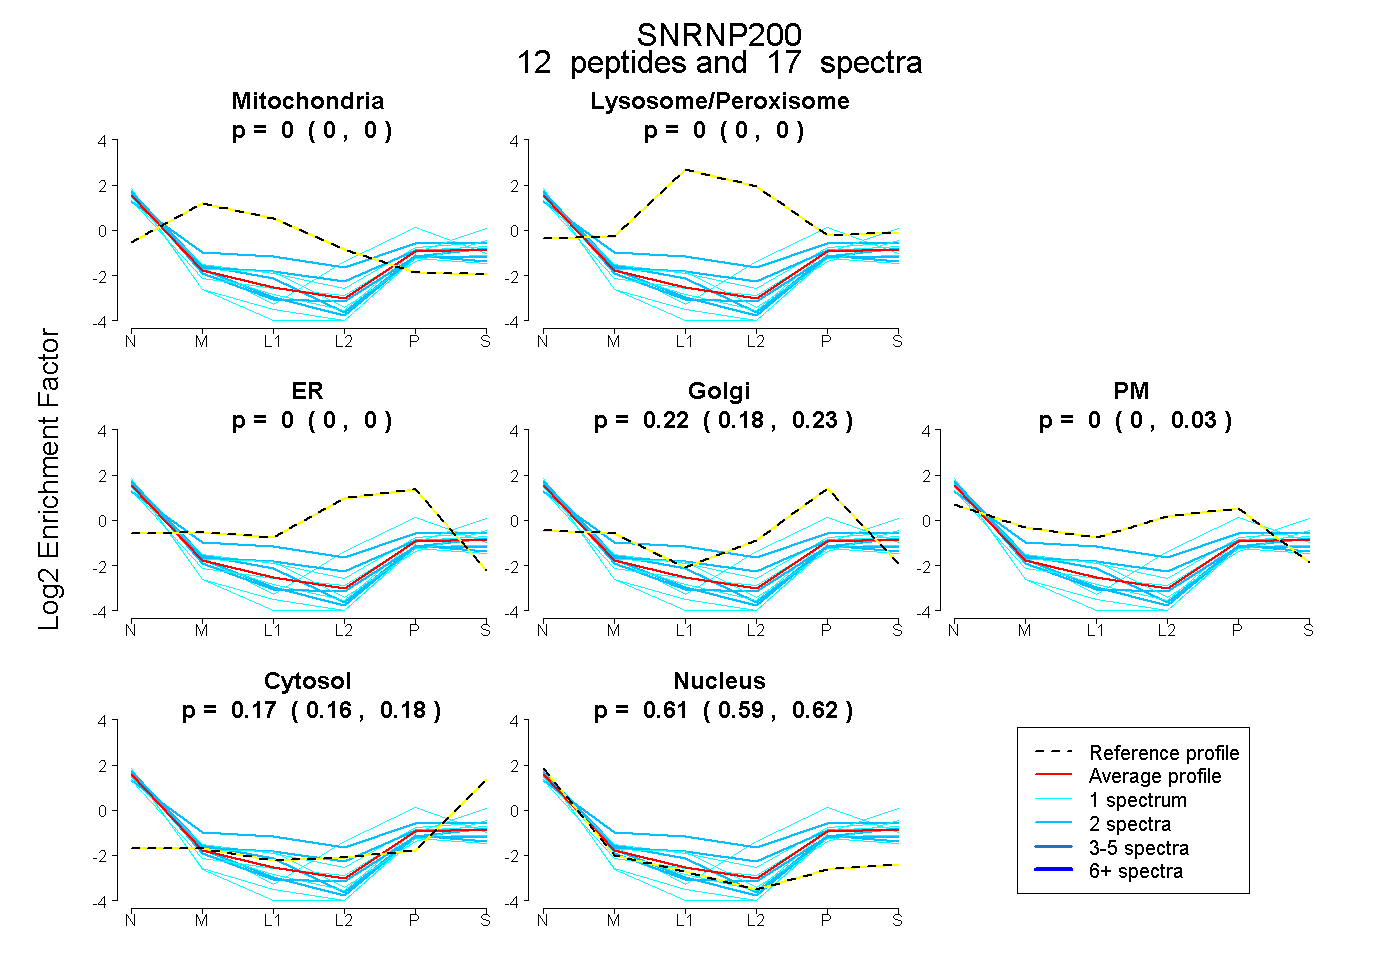
0.000 | 0.000
0.000 | 0.000
0.000 | 0.000
0.182 | 0.225
0.000 | 0.034
0.161 | 0.182
0.594 | 0.622