 4
4peptides
spectra
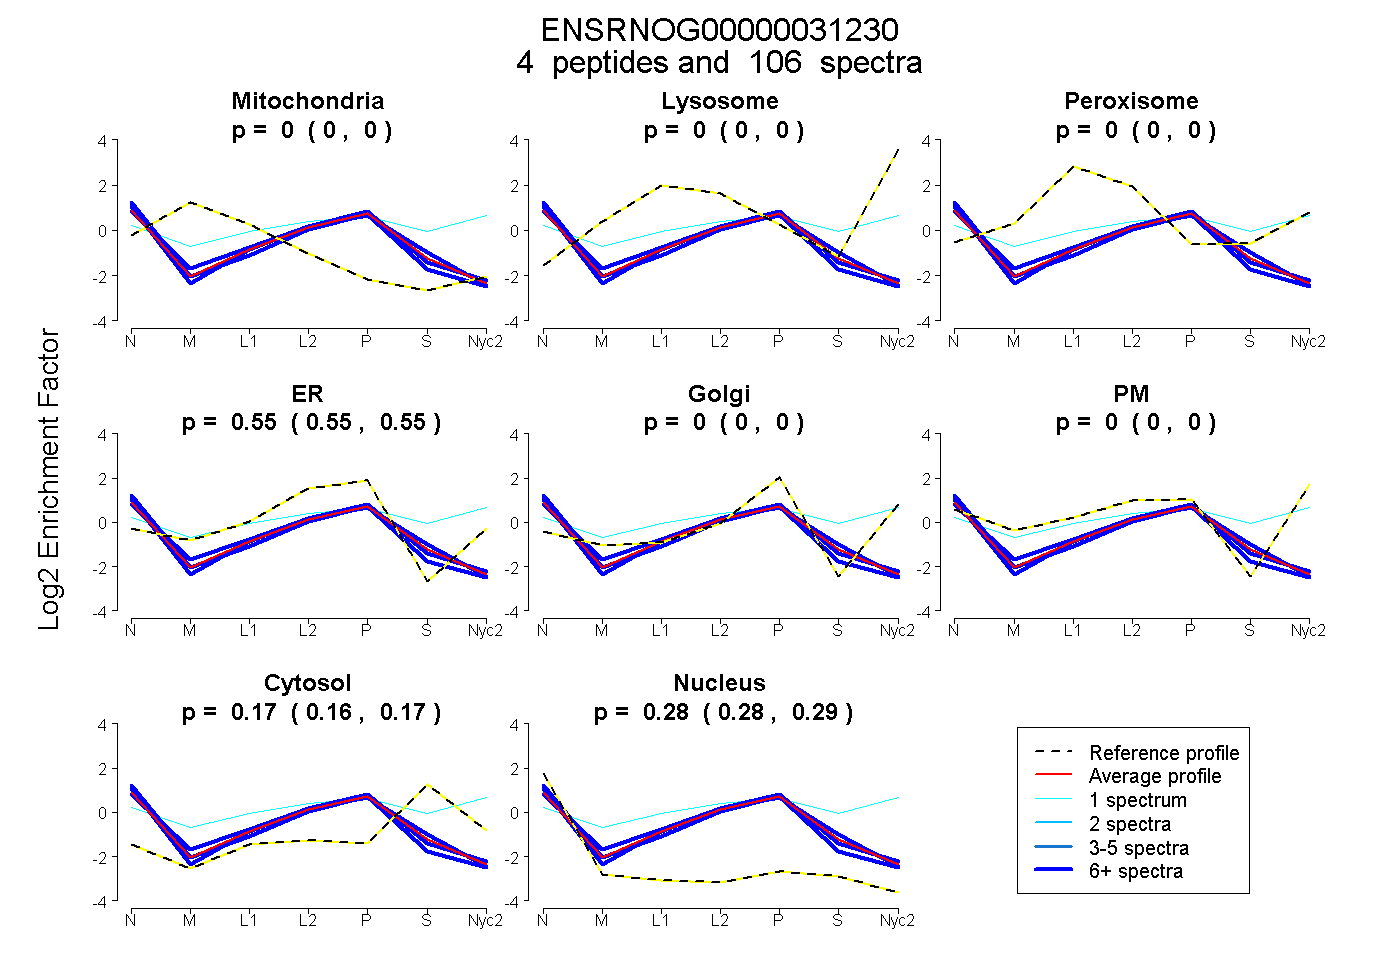
0.000 | 0.000
0.000 | 0.000
0.000 | 0.000
0.546 | 0.555
0.000 | 0.000
0.000 | 0.000
0.156 | 0.174
0.278 | 0.288
2peptides
spectra
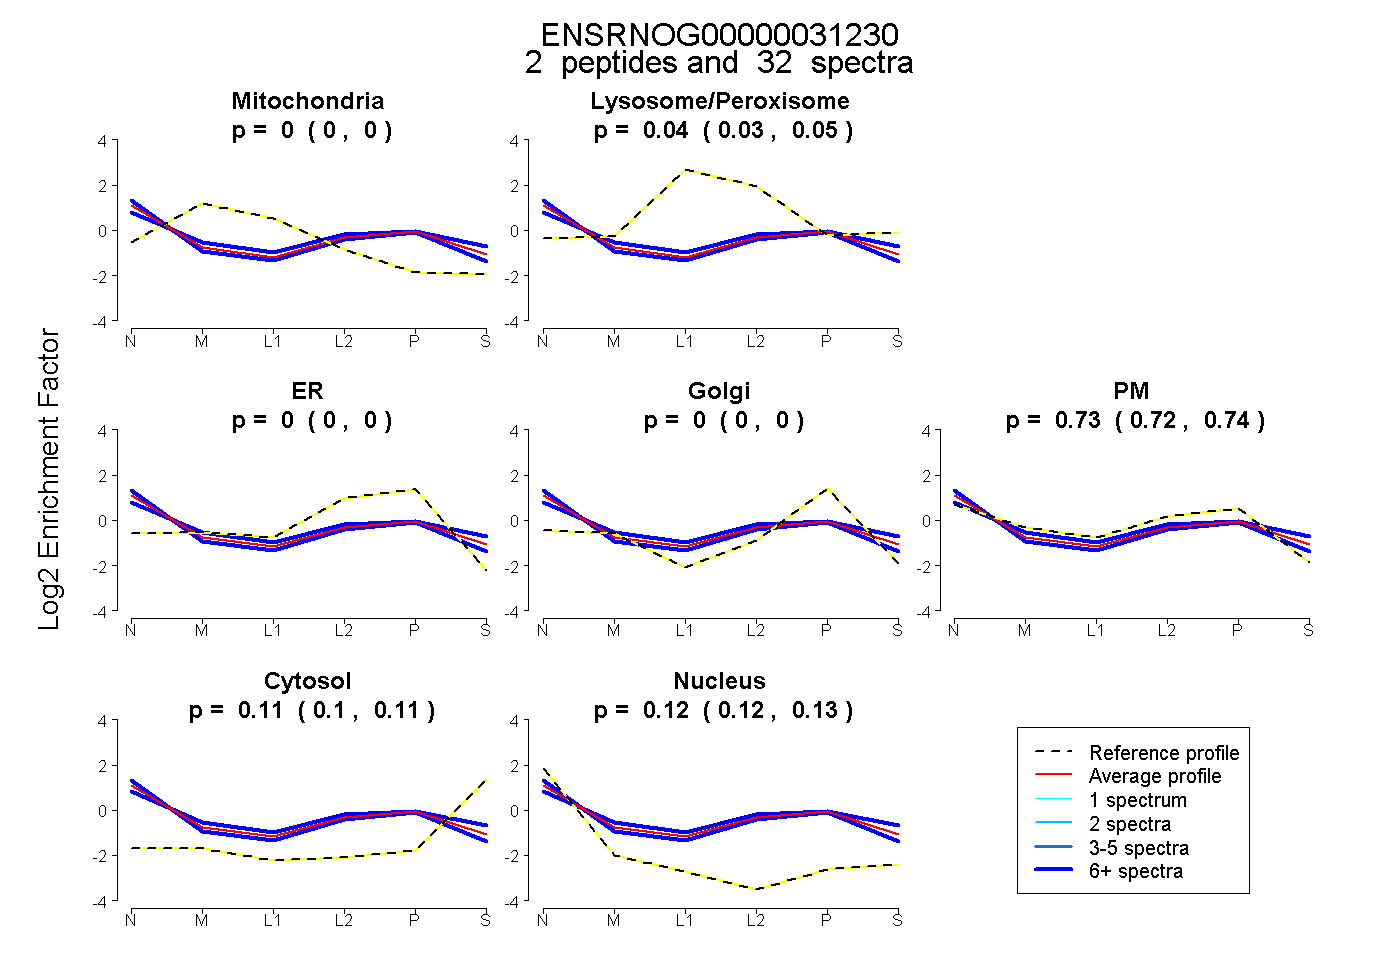
0.000 | 0.000
0.029 | 0.045
0.000 | 0.000
0.000 | 0.000
0.722 | 0.742
0.098 | 0.112
0.118 | 0.130
3peptides
spectra
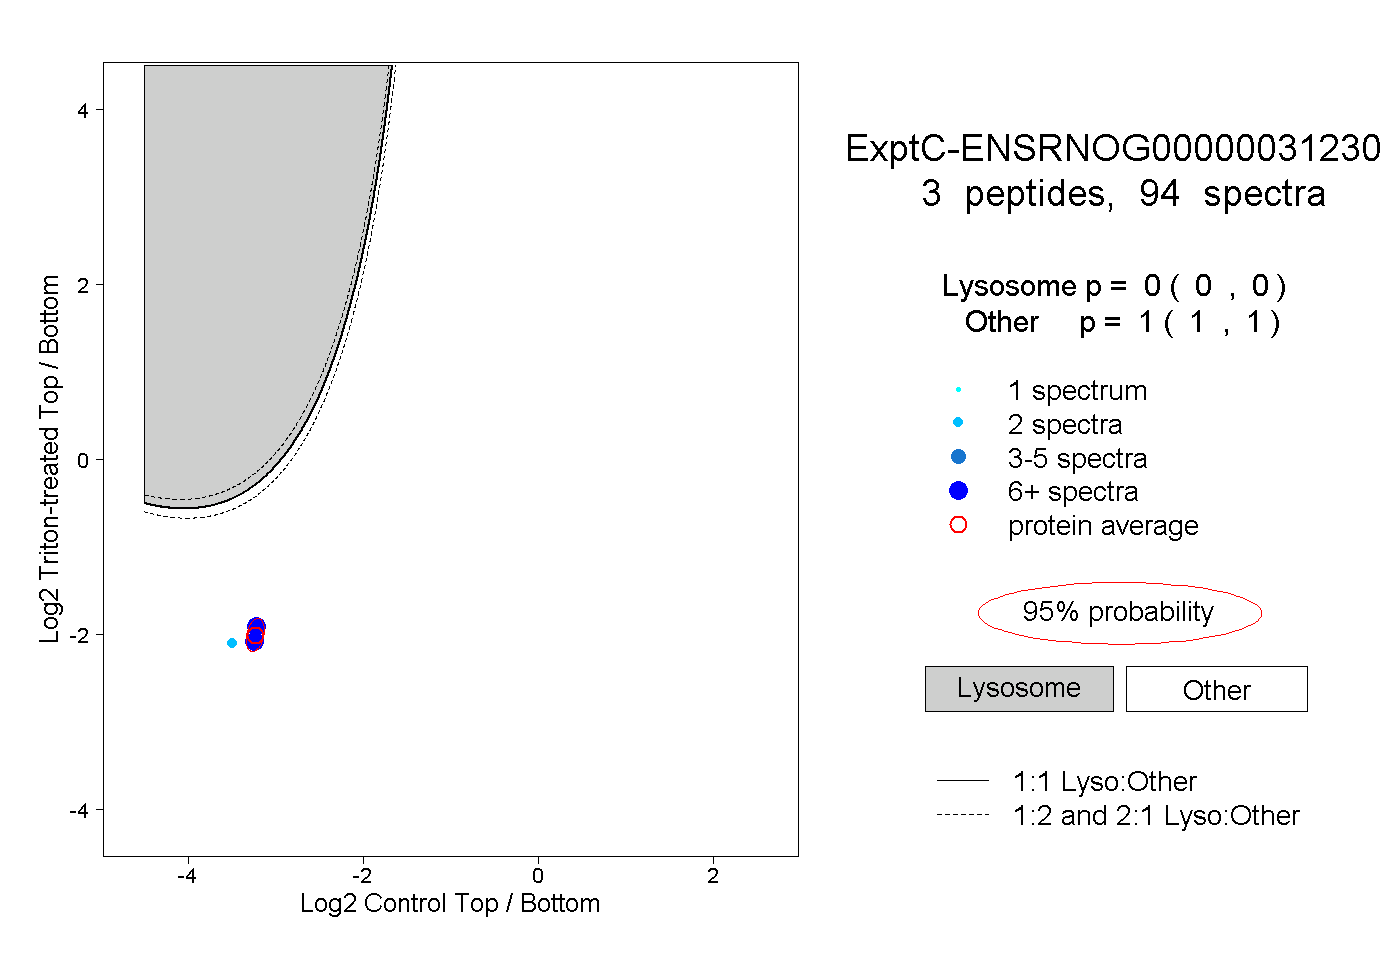
0.000 | 0.000
1.000 | 1.000
3peptides
spectra
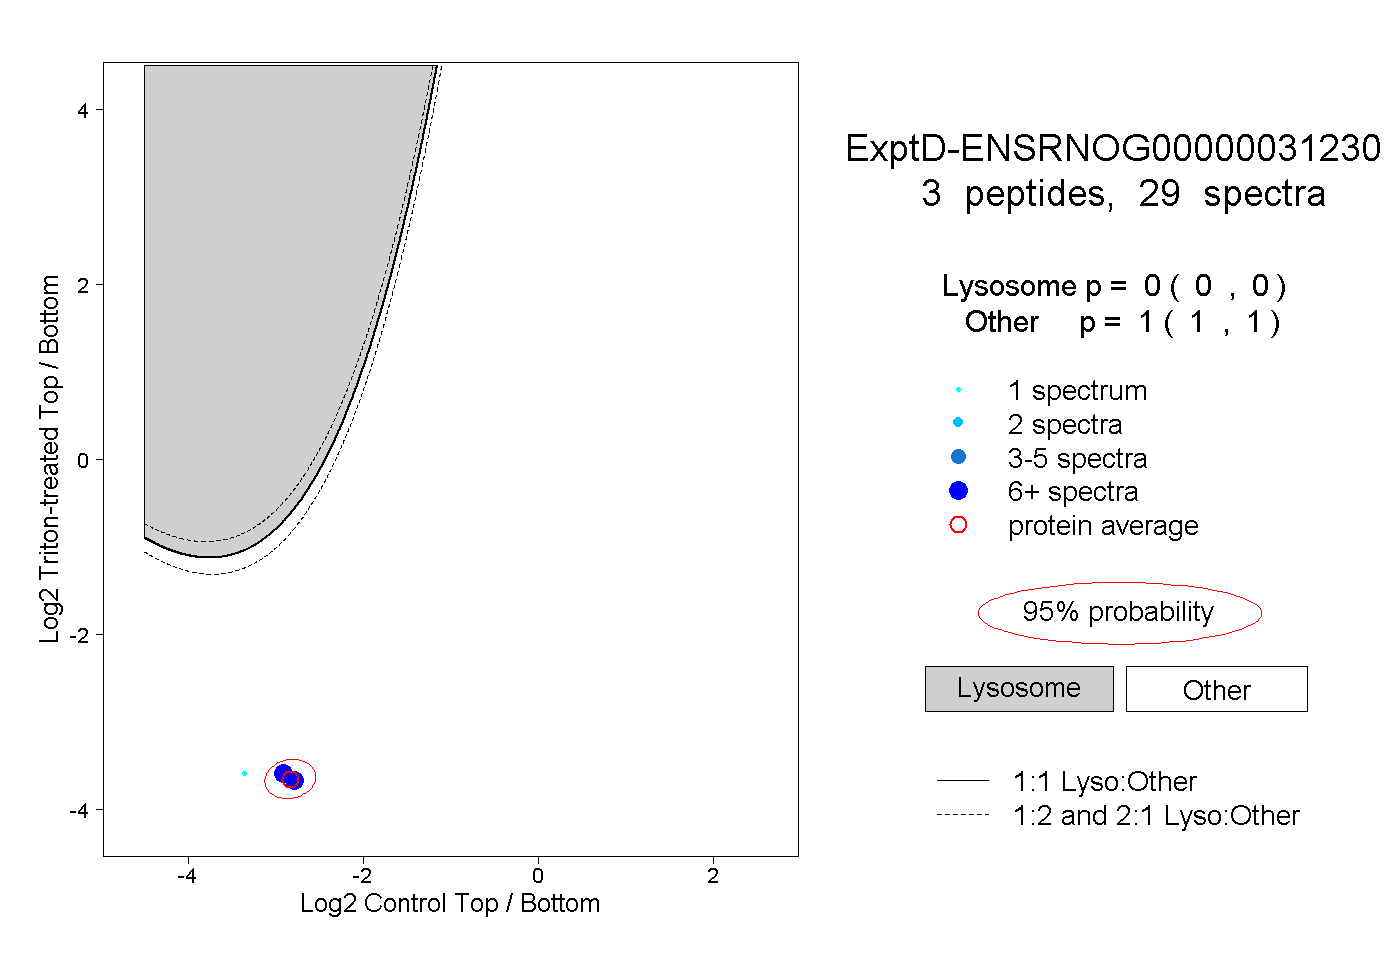
0.000 | 0.000
1.000 | 1.000