 61
61peptides
spectra
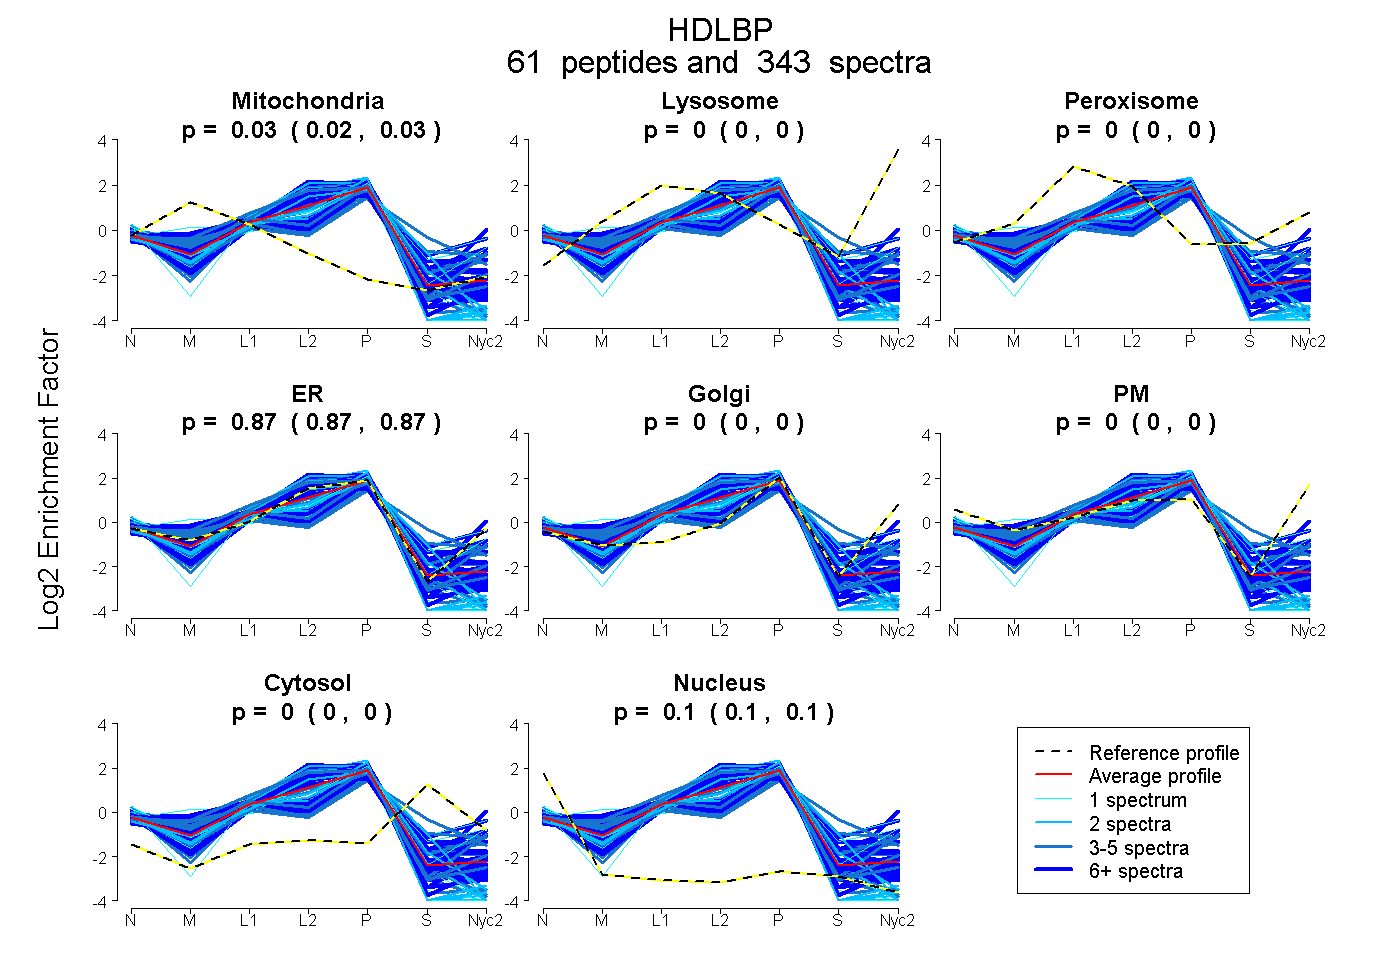
0.024 | 0.027
0.000 | 0.000
0.000 | 0.000
0.869 | 0.871
0.000 | 0.000
0.000 | 0.000
0.000 | 0.000
0.103 | 0.105
45peptides
spectra
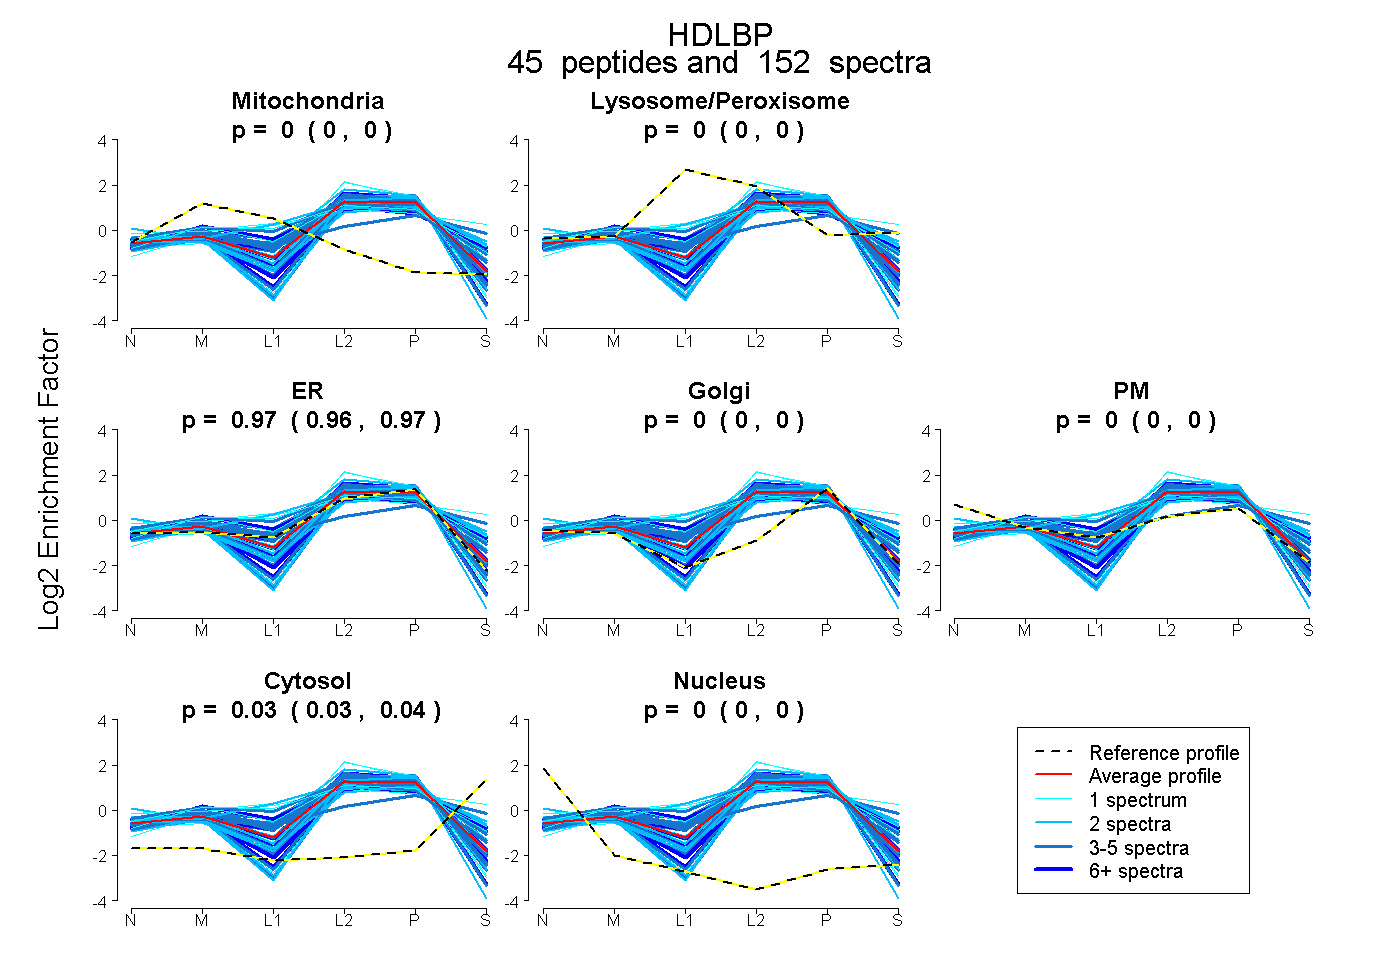
0.000 | 0.000
0.000 | 0.000
0.964 | 0.968
0.000 | 0.000
0.000 | 0.000
0.031 | 0.036
0.000 | 0.000
57peptides
spectra
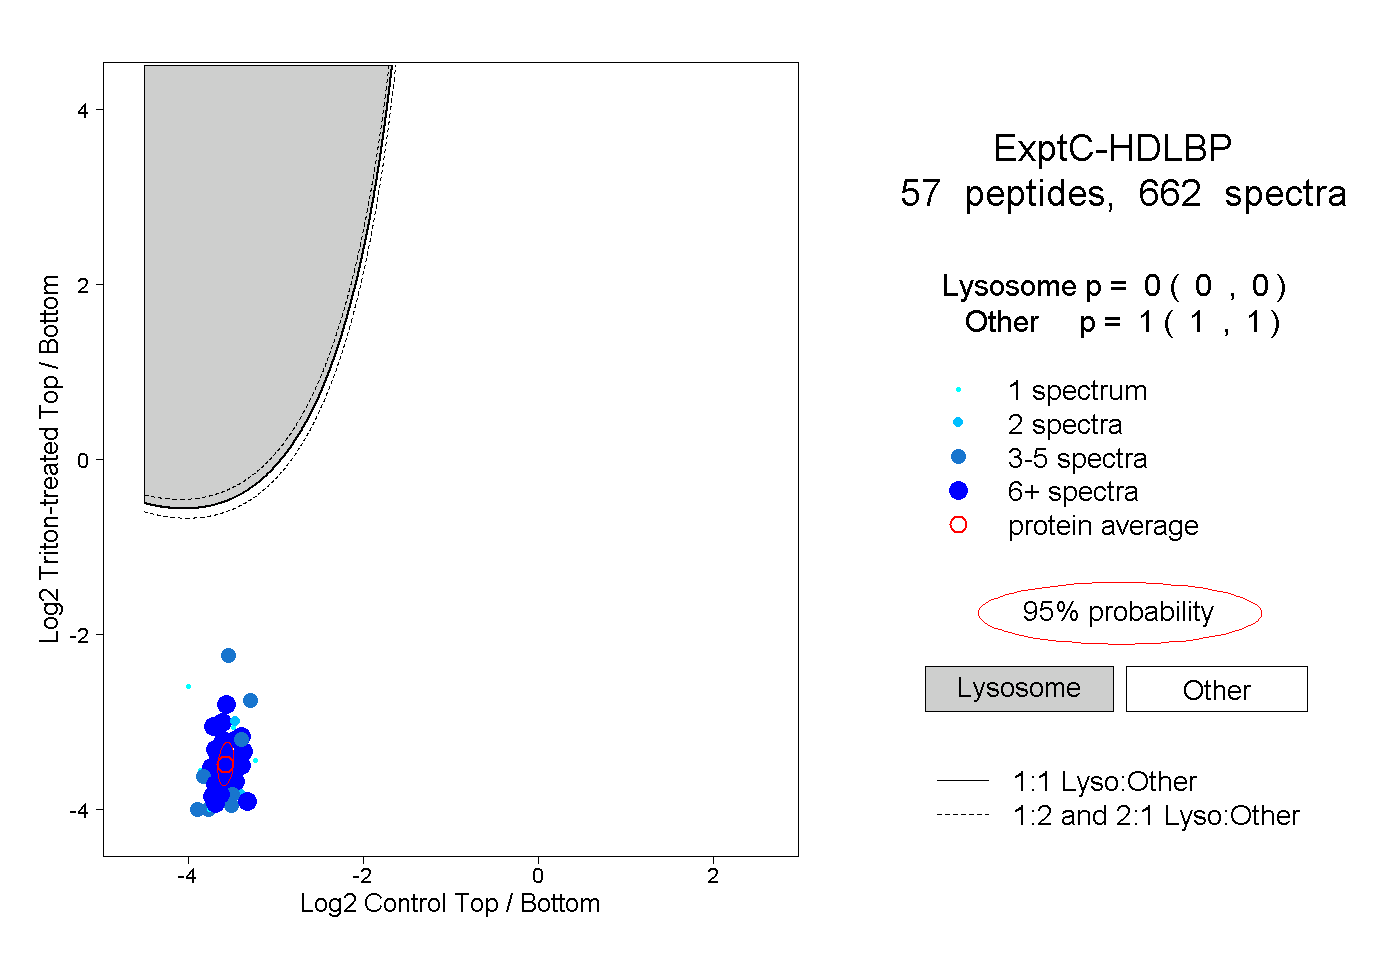
0.000 | 0.000
1.000 | 1.000
29peptides
spectra
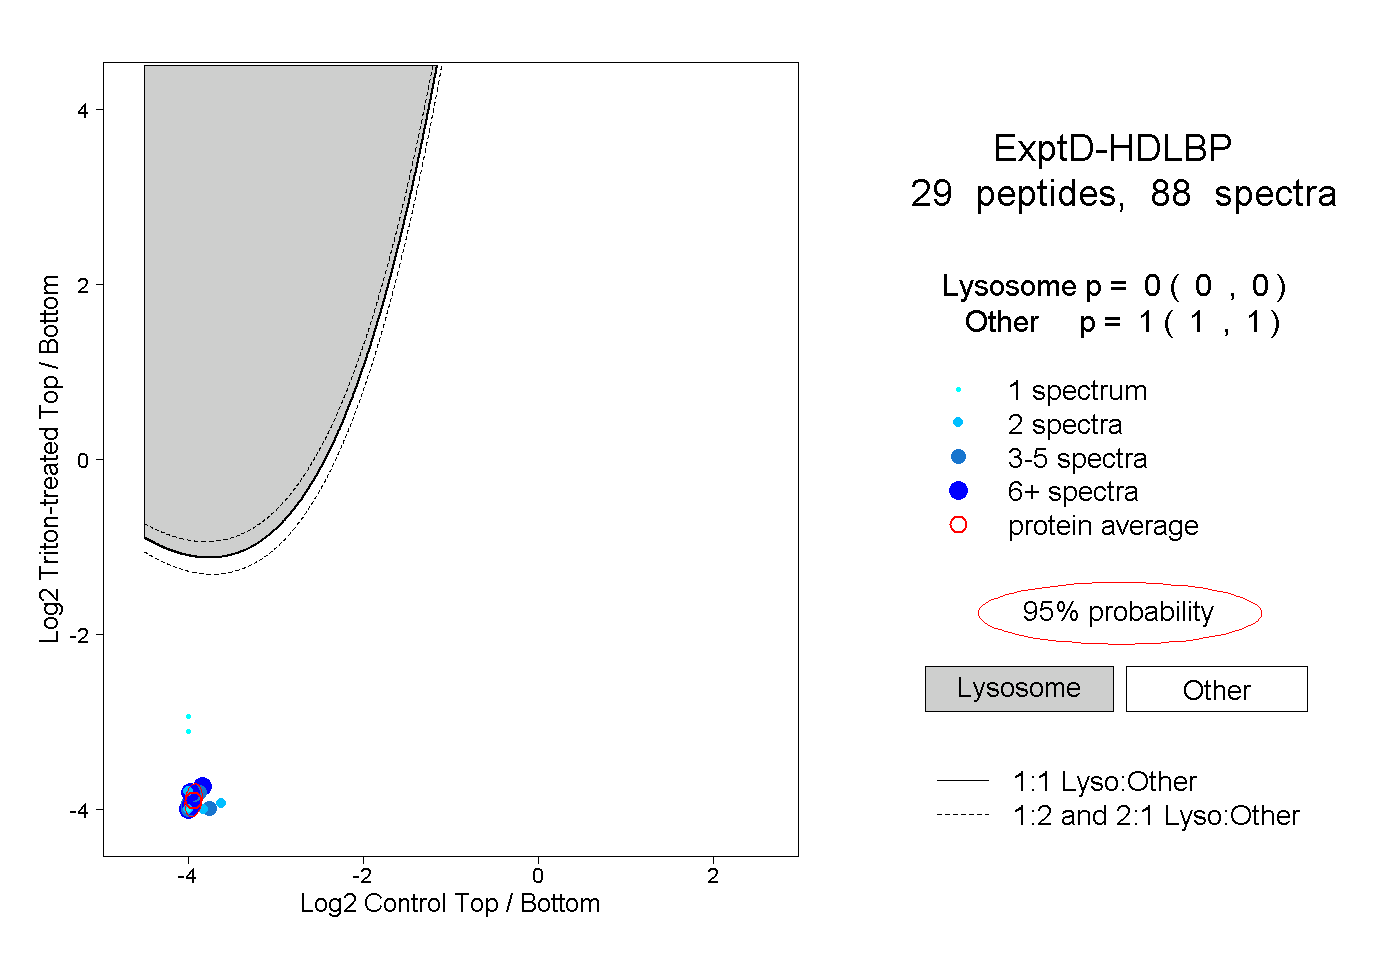
0.000 | 0.000
1.000 | 1.000