 1
1peptide
spectra

0.053 | 0.563
0.000 | 0.000
0.000 | 0.000
0.000 | 0.000
0.000 | 0.000
0.000 | 0.000
0.185 | 0.612
0.081 | 0.407
2peptides
spectra
0.000 | 0.000
1.000 | 1.000
| Plot | Mito | Lyso | Perox | ER | Golgi | PM | Cytosol | Nucleus | |||||
| Expt A |
1 peptide |
4 spectra |
|
0.333 0.053 | 0.563 |
0.000 0.000 | 0.000 |
0.000 0.000 | 0.000 |
0.000 0.000 | 0.000 |
0.000 0.000 | 0.000 |
0.000 0.000 | 0.000 |
0.413 0.185 | 0.612 |
0.254 0.081 | 0.407 |
||
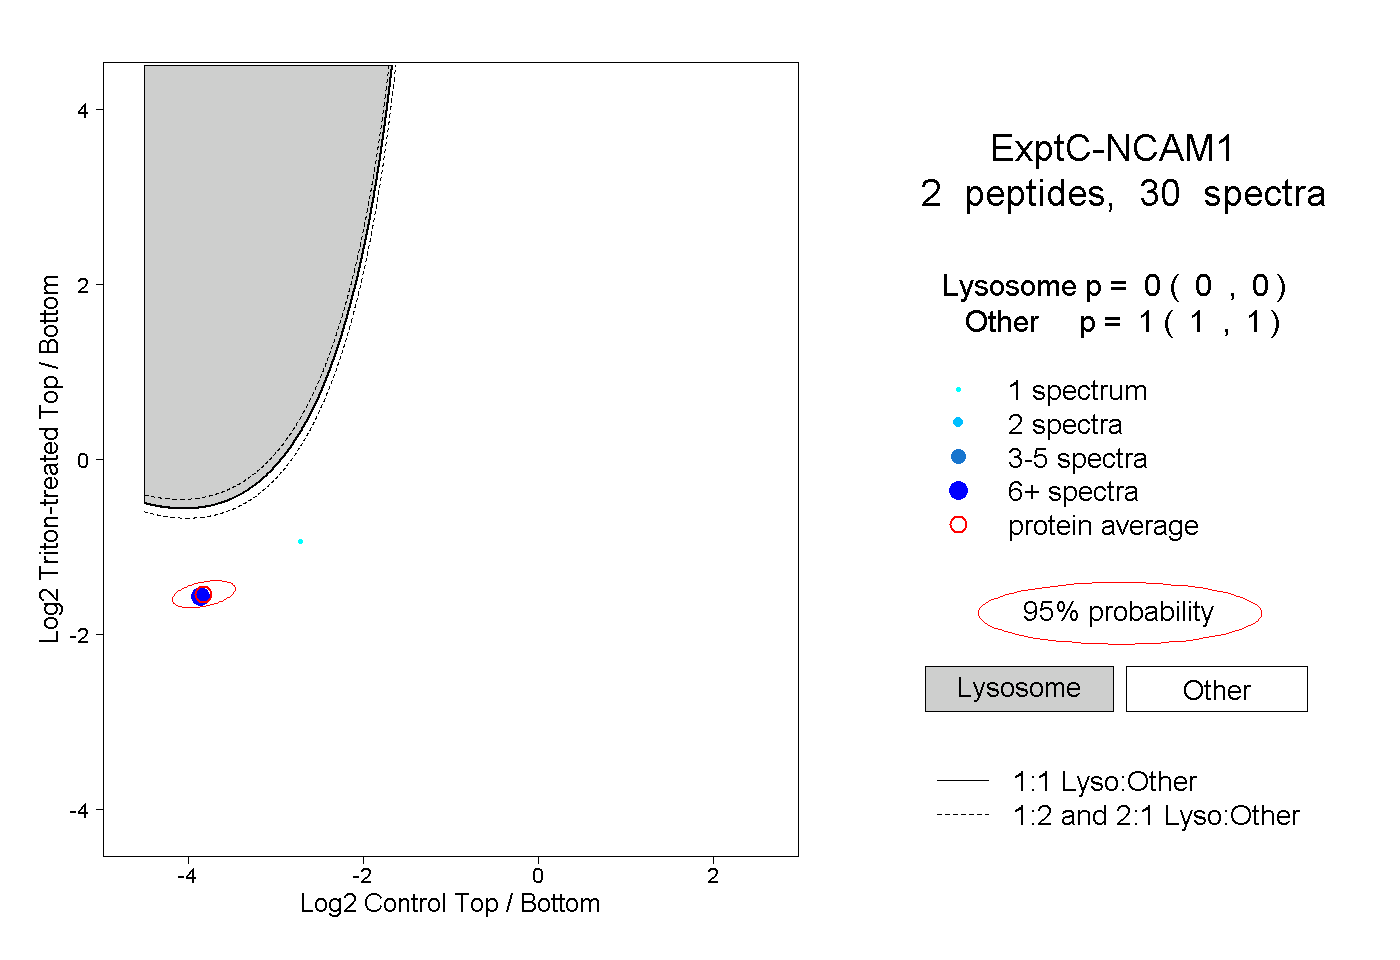
| Plot | Lyso | Other | |||||||||||
| Expt C |
2 peptides |
30 spectra |
|
0.000 0.000 | 0.000 |
1.000 1.000 | 1.000 |