 9
9peptides
spectra
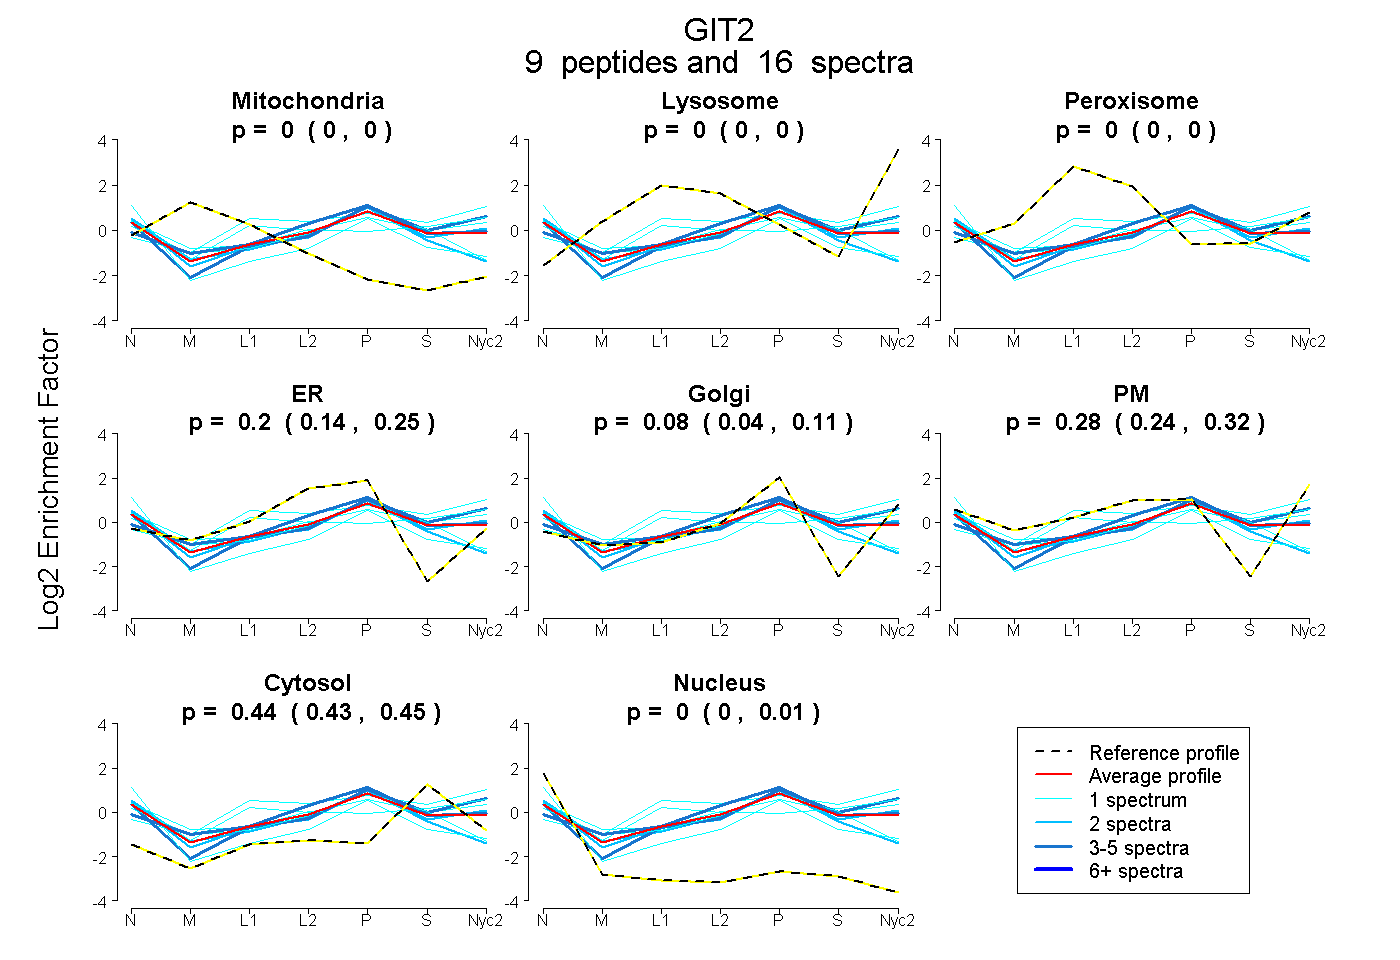
0.000 | 0.000
0.000 | 0.000
0.000 | 0.000
0.145 | 0.248
0.035 | 0.111
0.238 | 0.320
0.428 | 0.447
0.000 | 0.009
| Plot | Mito | Lyso | Perox | ER | Golgi | PM | Cytosol | Nucleus | |||||
| Expt A |
9 peptides |
16 spectra |
|
0.000 0.000 | 0.000 |
0.000 0.000 | 0.000 |
0.000 0.000 | 0.000 |
0.204 0.145 | 0.248 |
0.078 0.035 | 0.111 |
0.278 0.238 | 0.320 |
0.439 0.428 | 0.447 |
0.000 0.000 | 0.009 |
| 1 spectrum, TPVDYAR | 0.000 | 0.000 | 0.000 | 0.205 | 0.205 | 0.048 | 0.280 | 0.261 | ||
| 1 spectrum, LQPFPTHIGR | 0.000 | 0.179 | 0.223 | 0.000 | 0.190 | 0.090 | 0.318 | 0.000 | ||
| 1 spectrum, SNDVCADCSGPDPSWASVNR | 0.000 | 0.000 | 0.060 | 0.000 | 0.000 | 0.476 | 0.464 | 0.000 | ||
| 3 spectra, NIQELLR | 0.000 | 0.000 | 0.000 | 0.000 | 0.264 | 0.310 | 0.427 | 0.000 | ||
| 1 spectrum, TGNLETCLR | 0.011 | 0.000 | 0.000 | 0.490 | 0.000 | 0.000 | 0.453 | 0.047 | ||
| 2 spectra, LVEIQYELTDR | 0.000 | 0.000 | 0.000 | 0.042 | 0.276 | 0.282 | 0.383 | 0.017 | ||
| 4 spectra, YQMLAFVHR | 0.000 | 0.000 | 0.062 | 0.273 | 0.176 | 0.120 | 0.369 | 0.000 | ||
| 1 spectrum, LQSECR | 0.000 | 0.000 | 0.136 | 0.008 | 0.019 | 0.440 | 0.397 | 0.000 | ||
| 2 spectra, LAFYLCGR | 0.000 | 0.000 | 0.000 | 0.531 | 0.000 | 0.000 | 0.346 | 0.123 |
| Plot | Mito | Lyso or Perox | ER | Golgi | PM | Cytosol | Nucleus | ||||||
| Expt B |
1 peptide |
1 spectrum |
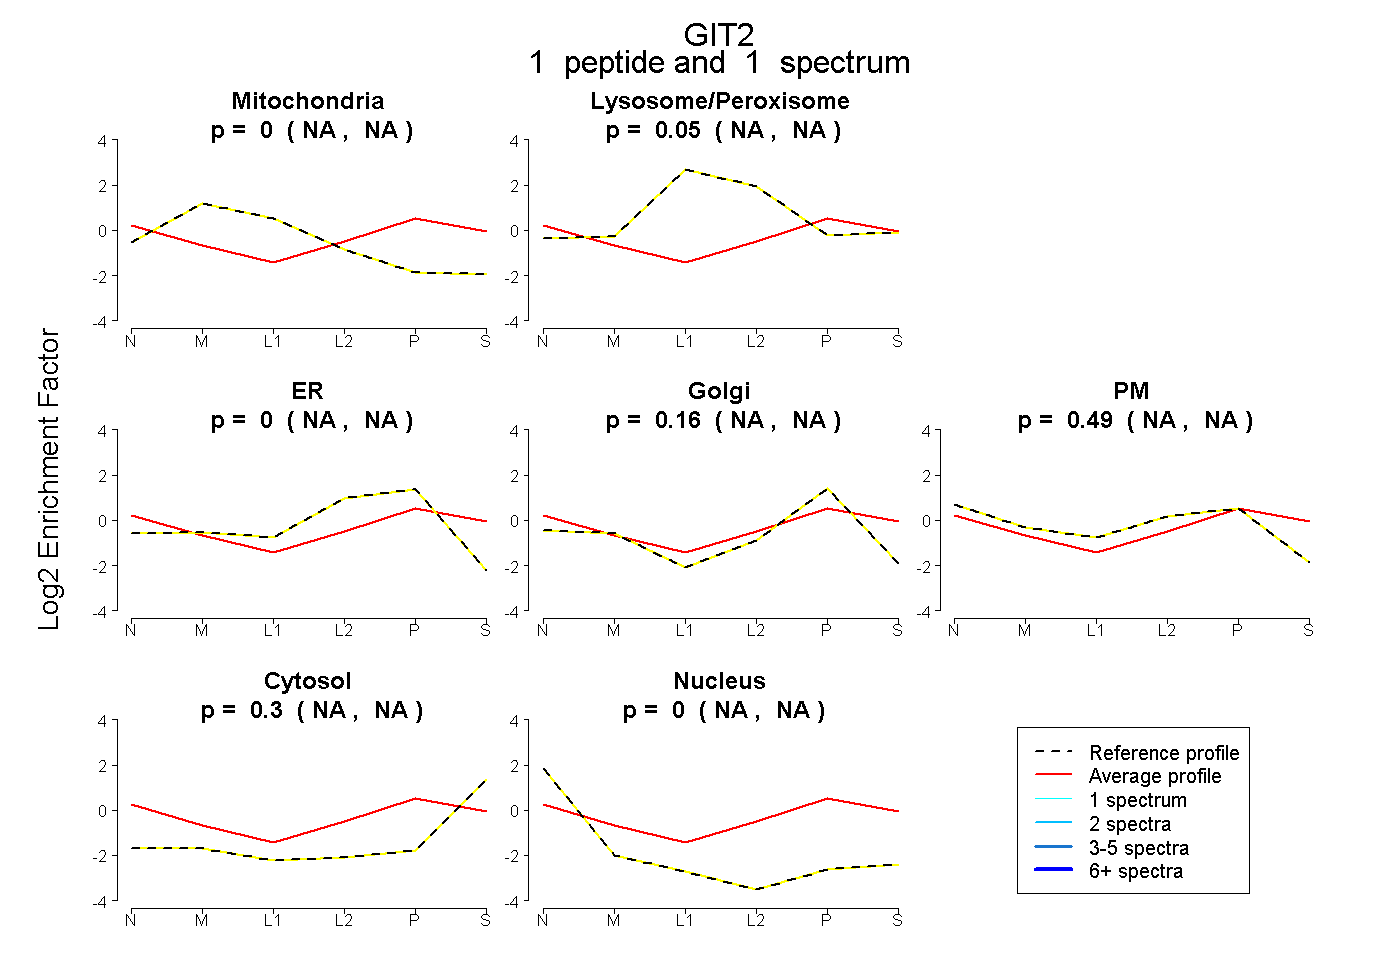 |
0.000 NA | NA |
0.049 NA | NA |
0.000 NA | NA |
0.164 NA | NA |
0.490 NA | NA |
0.298 NA | NA |
0.000 NA | NA |
|||
| Plot | Lyso | Other | |||||||||||
| Expt C |
4 peptides |
7 spectra |
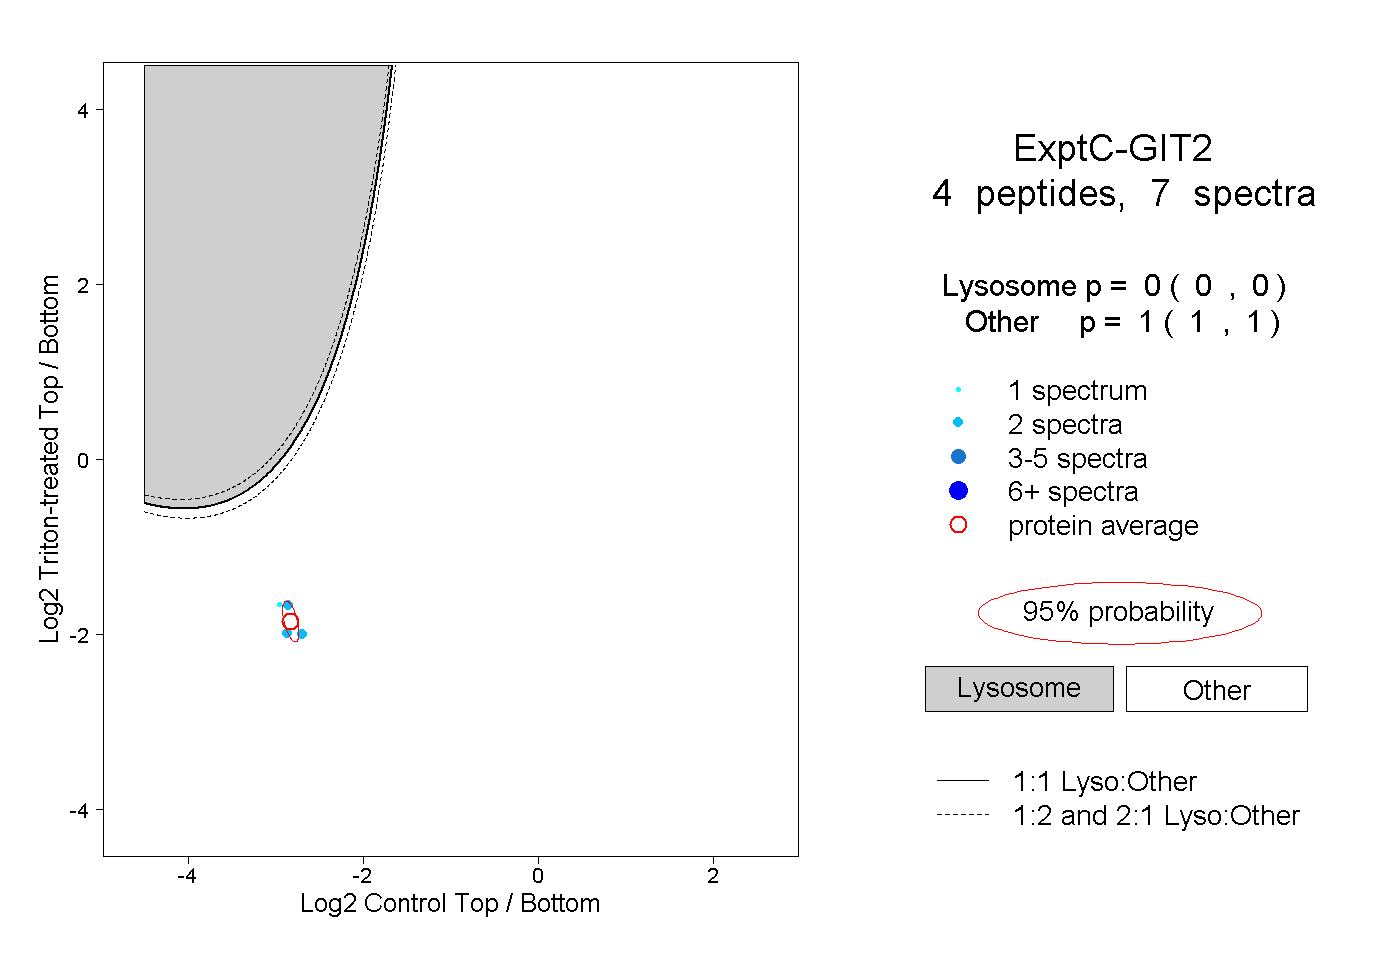 |
0.000 0.000 | 0.000 |
1.000 1.000 | 1.000 |