 4
4peptides
spectra
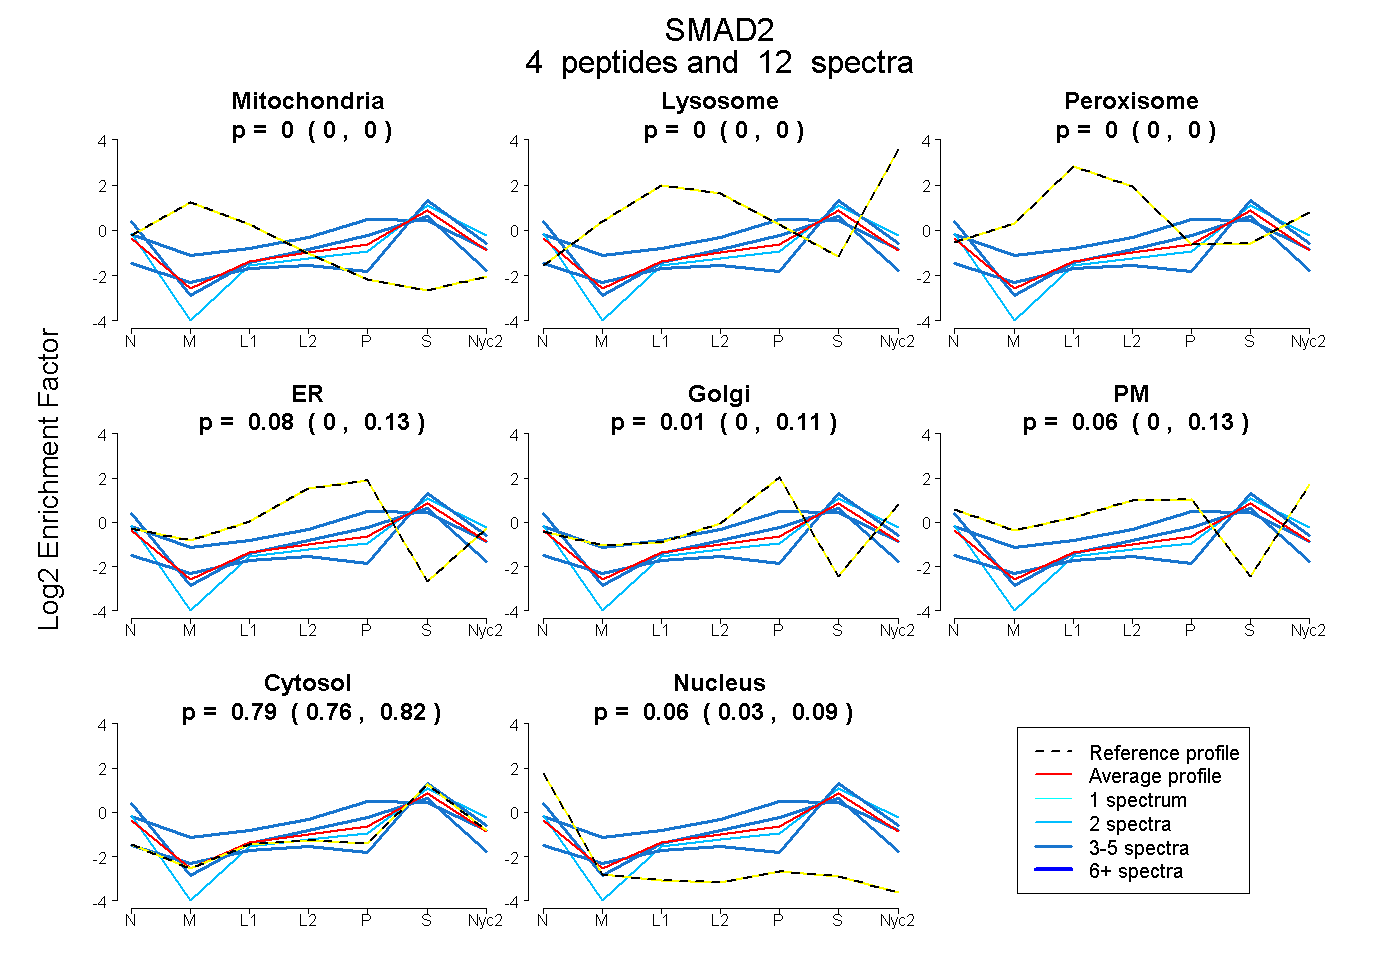
0.000 | 0.000
0.000 | 0.000
0.000 | 0.000
0.000 | 0.128
0.000 | 0.108
0.000 | 0.129
0.756 | 0.821
0.033 | 0.087
| Plot | Mito | Lyso | Perox | ER | Golgi | PM | Cytosol | Nucleus | |||||
| Expt A |
4 peptides |
12 spectra |
|
0.000 0.000 | 0.000 |
0.000 0.000 | 0.000 |
0.000 0.000 | 0.000 |
0.075 0.000 | 0.128 |
0.012 0.000 | 0.108 |
0.057 0.000 | 0.129 |
0.793 0.756 | 0.821 |
0.063 0.033 | 0.087 |
| 3 spectra, FCLGLLSNVNR | 0.000 | 0.000 | 0.000 | 0.182 | 0.000 | 0.000 | 0.639 | 0.179 | ||
| 2 spectra, VETPVLPPVLVPR | 0.000 | 0.000 | 0.000 | 0.000 | 0.000 | 0.053 | 0.882 | 0.064 | ||
| 4 spectra, VLTQMGSPSVR | 0.000 | 0.000 | 0.000 | 0.000 | 0.000 | 0.000 | 0.994 | 0.006 | ||
| 3 spectra, GLPHVIYCR | 0.005 | 0.000 | 0.044 | 0.327 | 0.054 | 0.000 | 0.570 | 0.000 |
| Plot | Lyso | Other | |||||||||||
| Expt C |
2 peptides |
4 spectra |
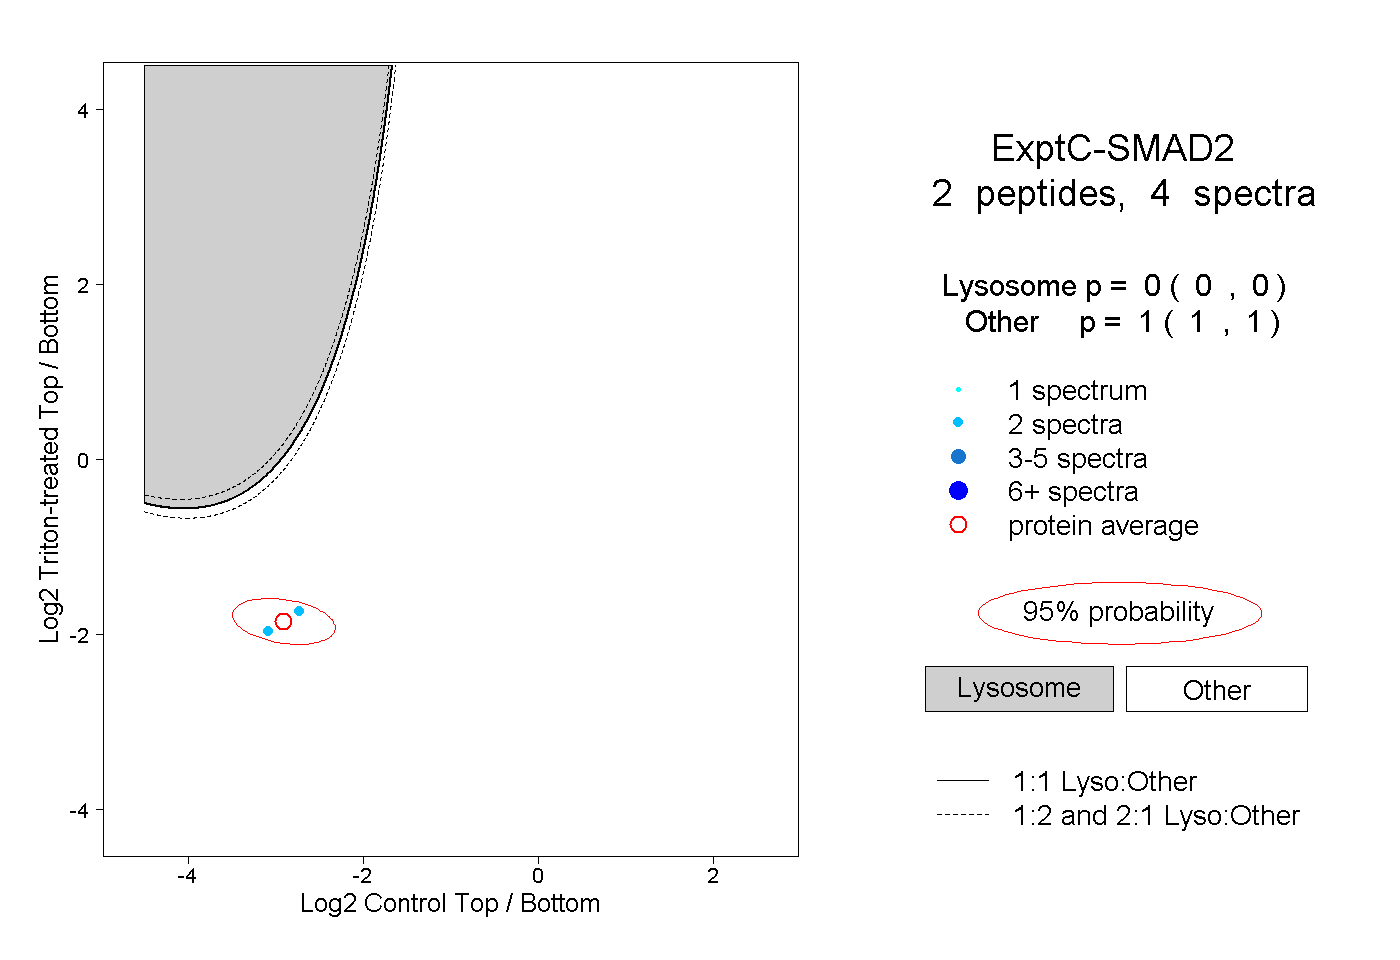 |
0.000 0.000 | 0.000 |
1.000 1.000 | 1.000 |