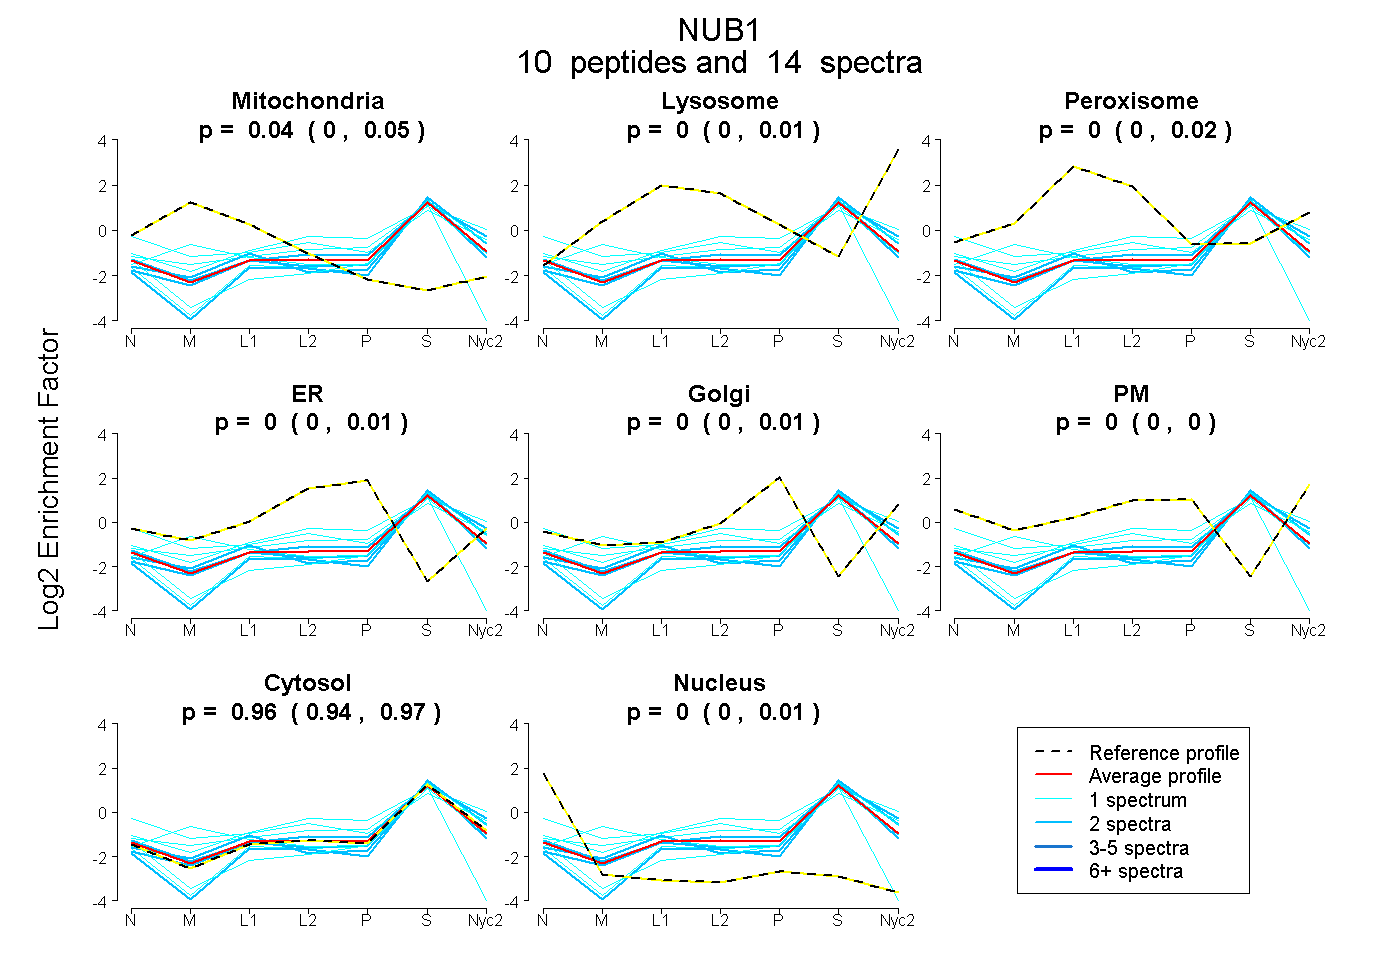
 10
10peptides
spectra
0.000 | 0.054
0.000 | 0.009
0.000 | 0.018
0.000 | 0.009
0.000 | 0.009
0.000 | 0.000
0.937 | 0.973
0.000 | 0.009
| Plot | Mito | Lyso | Perox | ER | Golgi | PM | Cytosol | Nucleus | |||||
| Expt A |
10 peptides |
14 spectra |
|
0.035 0.000 | 0.054 |
0.000 0.000 | 0.009 |
0.005 0.000 | 0.018 |
0.000 0.000 | 0.009 |
0.000 0.000 | 0.009 |
0.000 0.000 | 0.000 |
0.960 0.937 | 0.973 |
0.000 0.000 | 0.009 |
| 1 spectrum, GNLDDALK | 0.228 | 0.007 | 0.000 | 0.000 | 0.000 | 0.000 | 0.765 | 0.000 | ||
| 2 spectra, GMGYSTQAAK | 0.064 | 0.000 | 0.000 | 0.000 | 0.000 | 0.000 | 0.936 | 0.000 | ||
| 2 spectra, EELAQIR | 0.000 | 0.075 | 0.000 | 0.000 | 0.000 | 0.013 | 0.912 | 0.000 | ||
| 1 spectrum, ALMLAMGYHEK | 0.000 | 0.152 | 0.000 | 0.086 | 0.000 | 0.026 | 0.736 | 0.000 | ||
| 1 spectrum, ELYIDPSK | 0.000 | 0.000 | 0.000 | 0.000 | 0.000 | 0.000 | 1.000 | 0.000 | ||
| 2 spectra, GLEILAER | 0.000 | 0.000 | 0.000 | 0.000 | 0.000 | 0.000 | 1.000 | 0.000 | ||
| 1 spectrum, SLLETR | 0.000 | 0.000 | 0.000 | 0.000 | 0.000 | 0.000 | 0.954 | 0.046 | ||
| 2 spectra, EYGIALPCLLDADR | 0.010 | 0.000 | 0.000 | 0.000 | 0.000 | 0.000 | 0.990 | 0.000 | ||
| 1 spectrum, NYHSGNGEEAR | 0.065 | 0.000 | 0.095 | 0.000 | 0.000 | 0.153 | 0.687 | 0.000 | ||
| 1 spectrum, AMVLELK | 0.190 | 0.000 | 0.000 | 0.000 | 0.000 | 0.000 | 0.716 | 0.094 |
| Plot | Mito | Lyso or Perox | ER | Golgi | PM | Cytosol | Nucleus | ||||||
| Expt B |
2 peptides |
4 spectra |
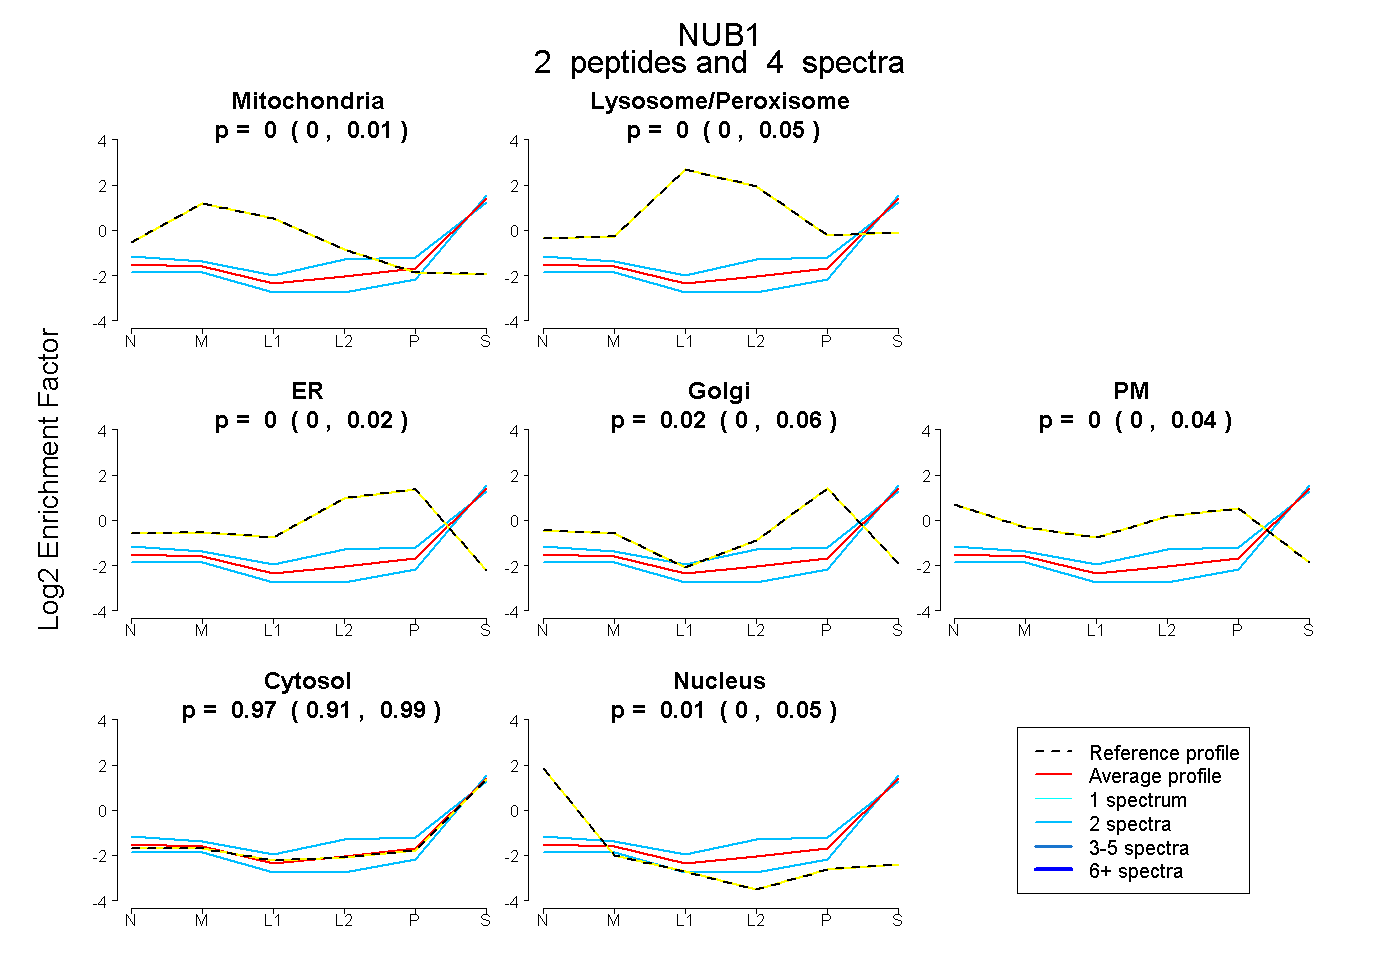 |
0.000 0.000 | 0.011 |
0.000 0.000 | 0.046 |
0.000 0.000 | 0.019 |
0.016 0.000 | 0.055 |
0.003 0.000 | 0.037 |
0.971 0.911 | 0.991 |
0.010 0.000 | 0.050 |
|||
| Plot | Lyso | Other | |||||||||||
| Expt C |
9 peptides |
13 spectra |
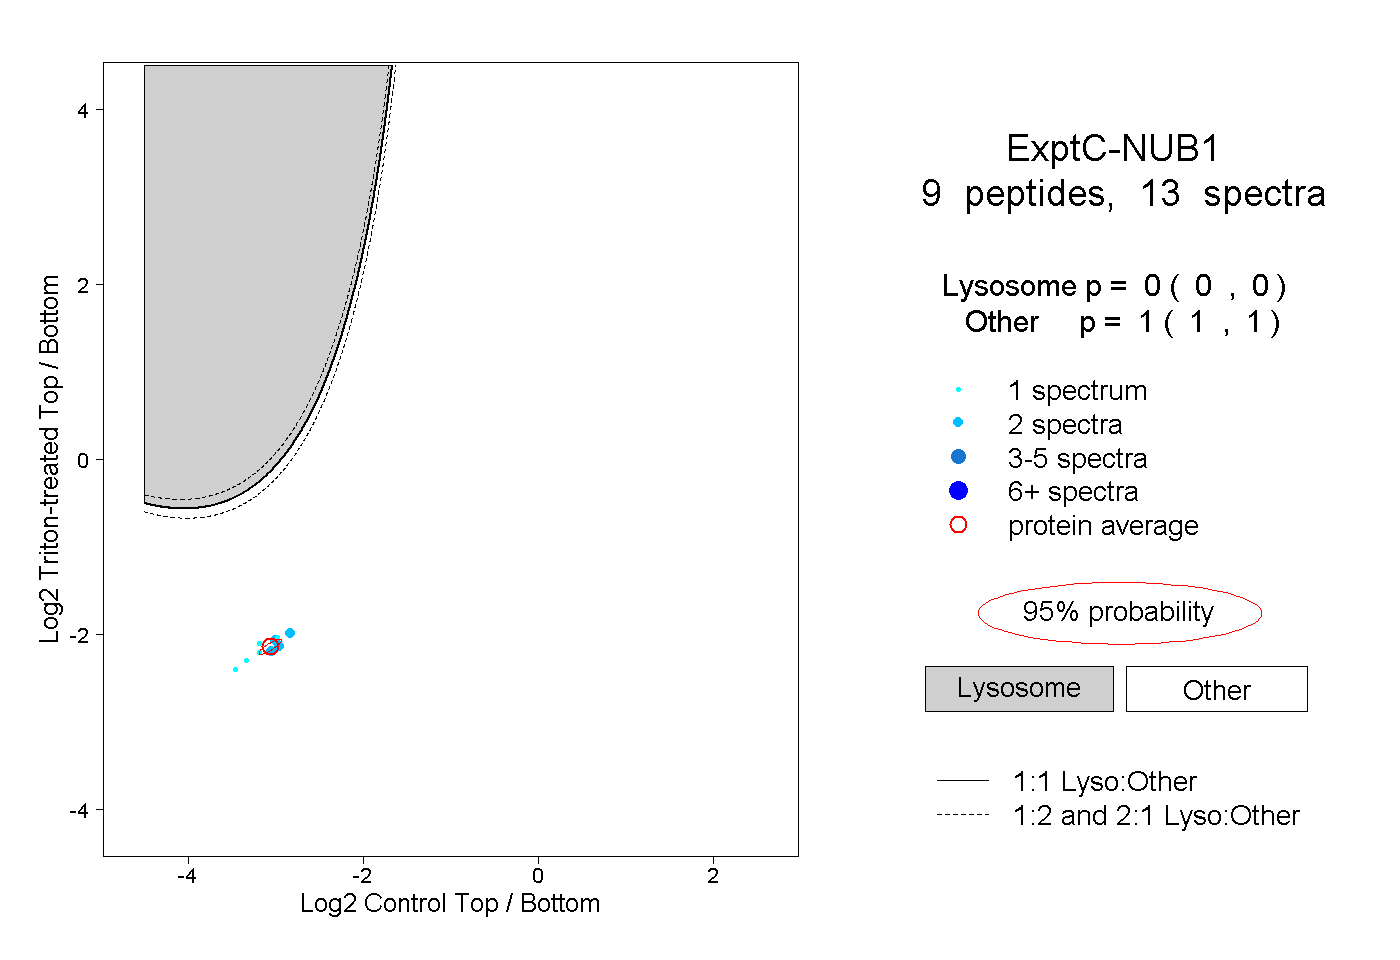 |
0.000 0.000 | 0.000 |
1.000 1.000 | 1.000 |