 5
5peptides
spectra
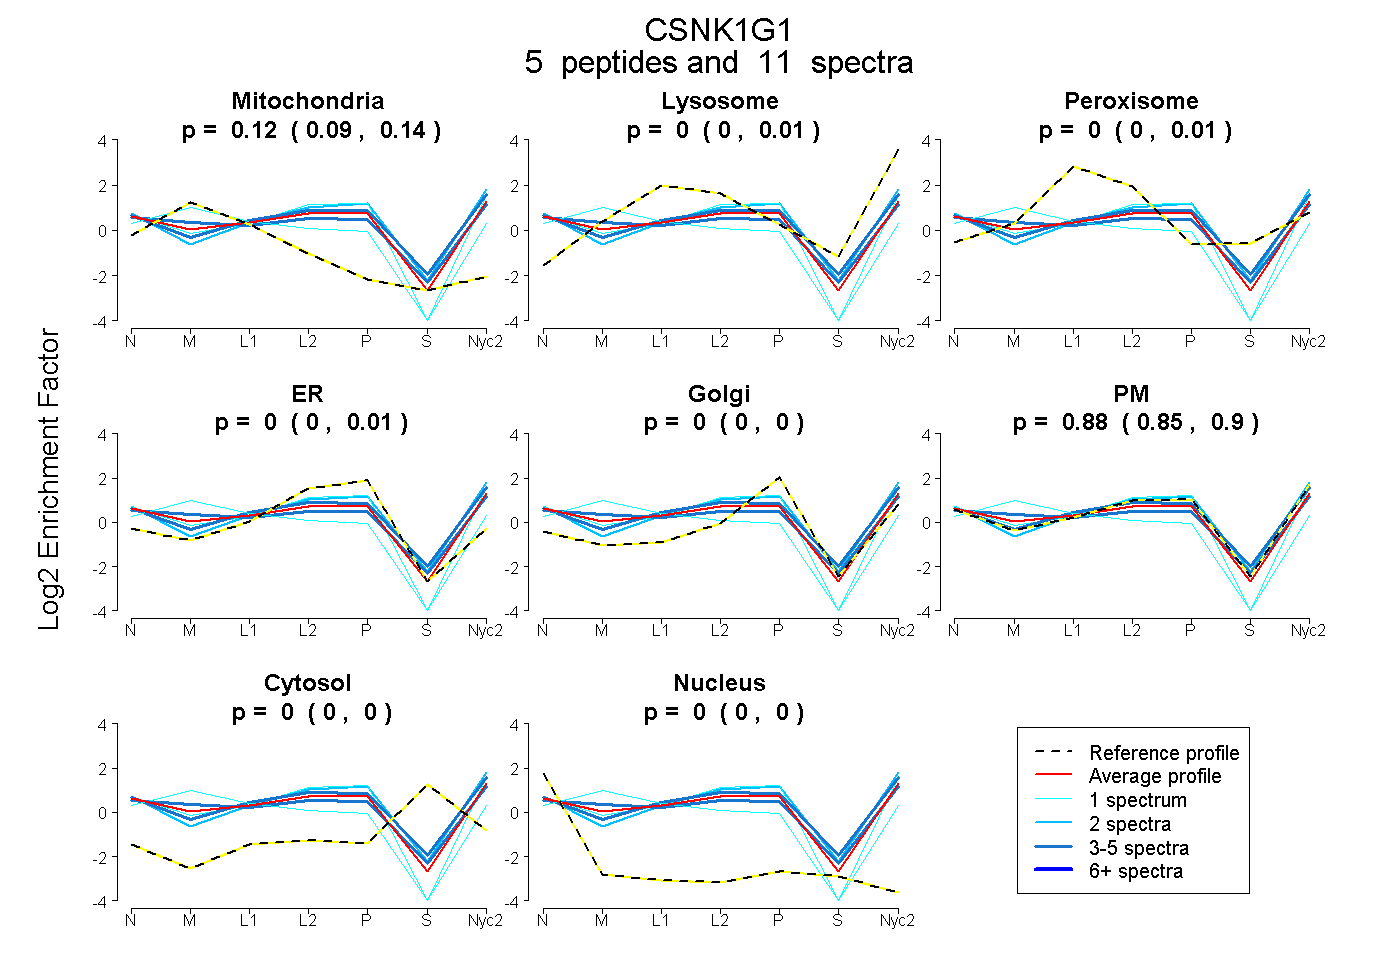
0.094 | 0.139
0.000 | 0.013
0.000 | 0.012
0.000 | 0.014
0.000 | 0.000
0.845 | 0.901
0.000 | 0.000
0.000 | 0.000
| Plot | Mito | Lyso | Perox | ER | Golgi | PM | Cytosol | Nucleus | |||||
| Expt A |
5 peptides |
11 spectra |
|
0.119 0.094 | 0.139 |
0.000 0.000 | 0.013 |
0.000 0.000 | 0.012 |
0.000 0.000 | 0.014 |
0.000 0.000 | 0.000 |
0.881 0.845 | 0.901 |
0.000 0.000 | 0.000 |
0.000 0.000 | 0.000 |
| 2 spectra, DVKPENFLIGR | 0.000 | 0.007 | 0.001 | 0.000 | 0.000 | 0.984 | 0.008 | 0.000 | ||
| 3 spectra, EYIDPETK | 0.191 | 0.036 | 0.000 | 0.000 | 0.000 | 0.774 | 0.000 | 0.000 | ||
| 1 spectrum, NLFTDLFER | 0.422 | 0.000 | 0.000 | 0.000 | 0.000 | 0.578 | 0.000 | 0.000 | ||
| 4 spectra, GSLPWQGLK | 0.000 | 0.000 | 0.094 | 0.000 | 0.000 | 0.872 | 0.034 | 0.000 | ||
| 1 spectrum, EHVIHIIDFGLAK | 0.000 | 0.000 | 0.000 | 0.097 | 0.000 | 0.903 | 0.000 | 0.000 |
| Plot | Lyso | Other | |||||||||||
| Expt C |
2 peptides |
5 spectra |
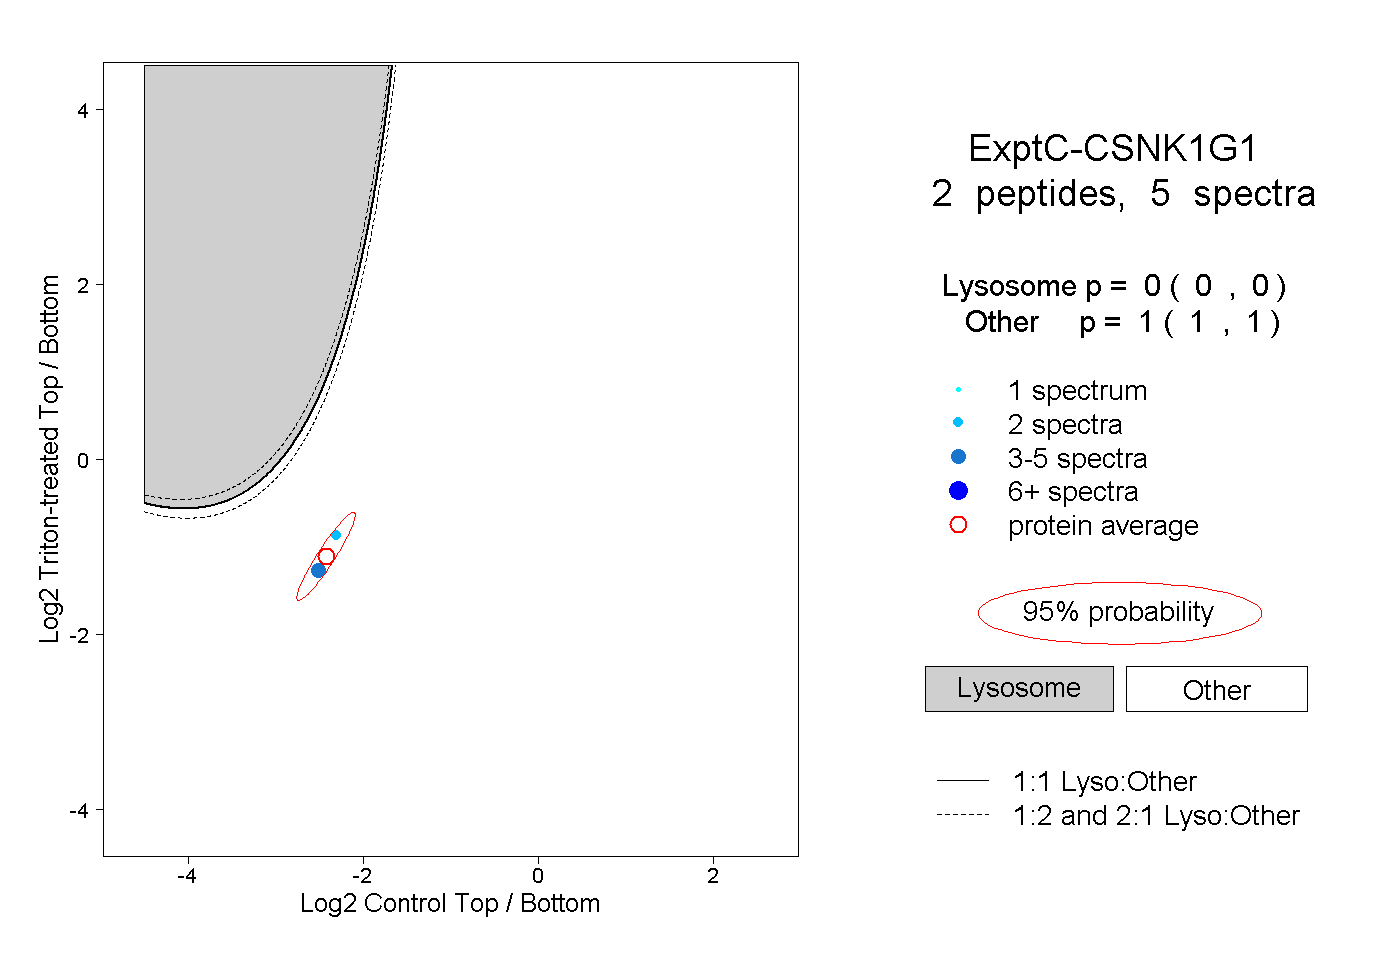 |
0.000 0.000 | 0.000 |
1.000 1.000 | 1.000 |