 14
14peptides
spectra
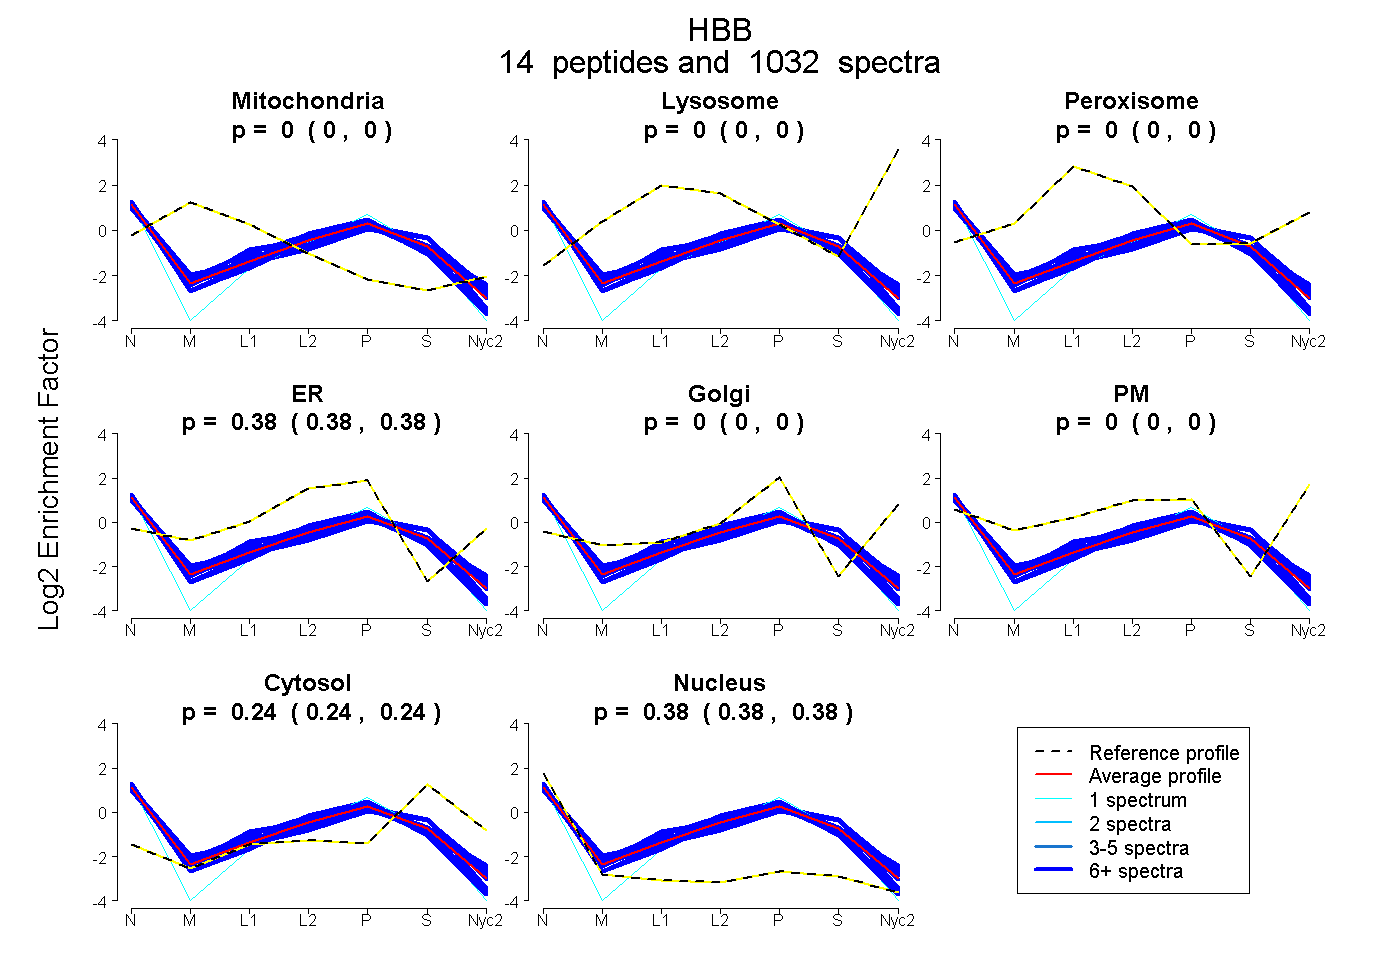
0.000 | 0.000
0.000 | 0.000
0.000 | 0.000
0.376 | 0.377
0.000 | 0.000
0.000 | 0.000
0.243 | 0.245
0.378 | 0.380
13peptides
spectra
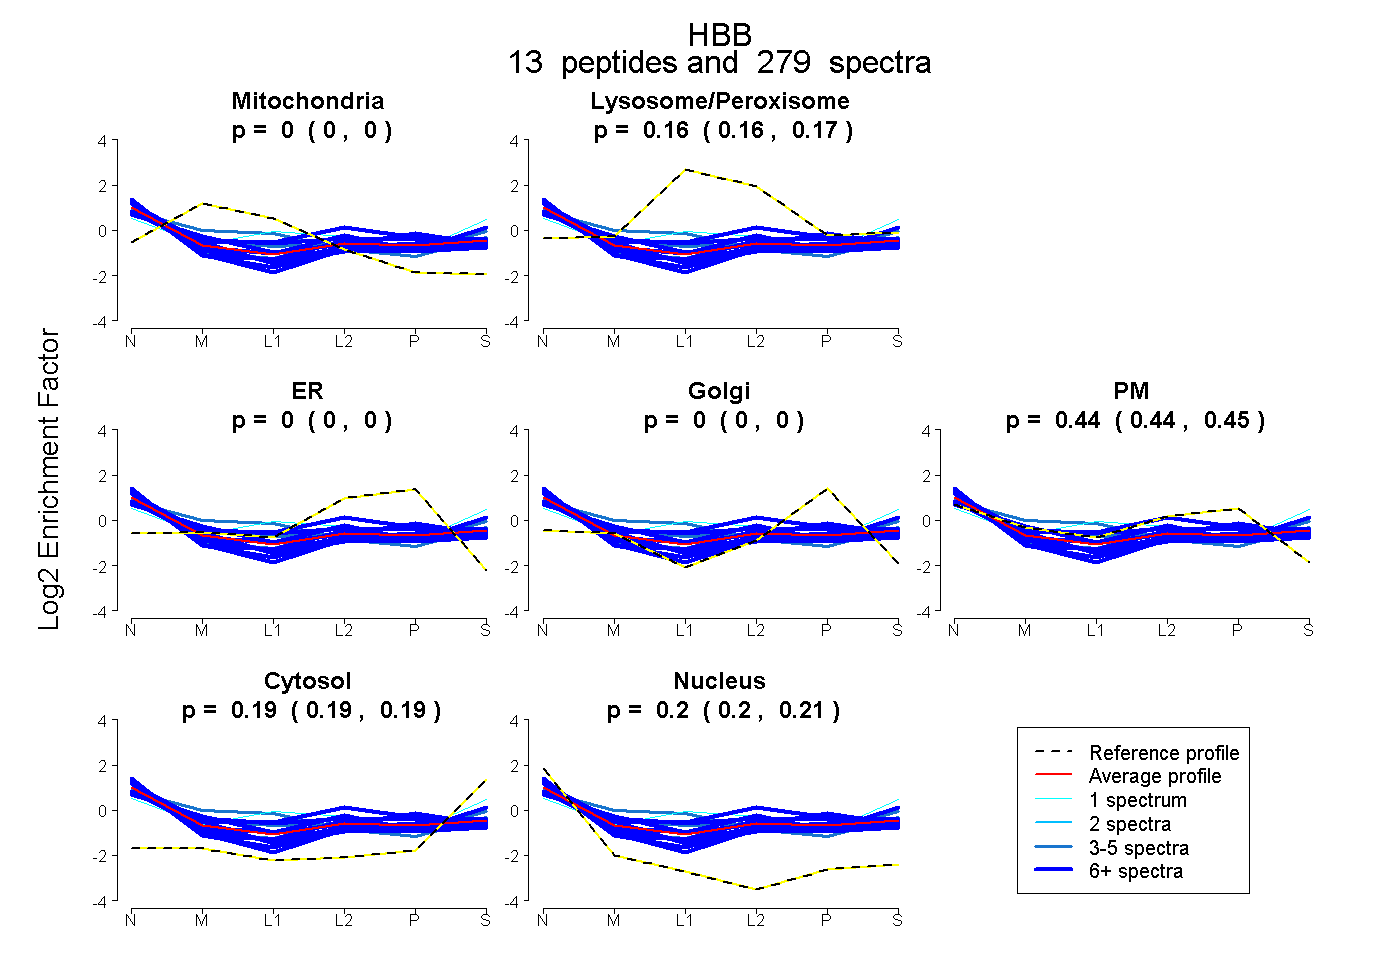
0.000 | 0.000
0.161 | 0.168
0.000 | 0.000
0.000 | 0.000
0.438 | 0.447
0.187 | 0.192
0.201 | 0.206
11peptides
spectra
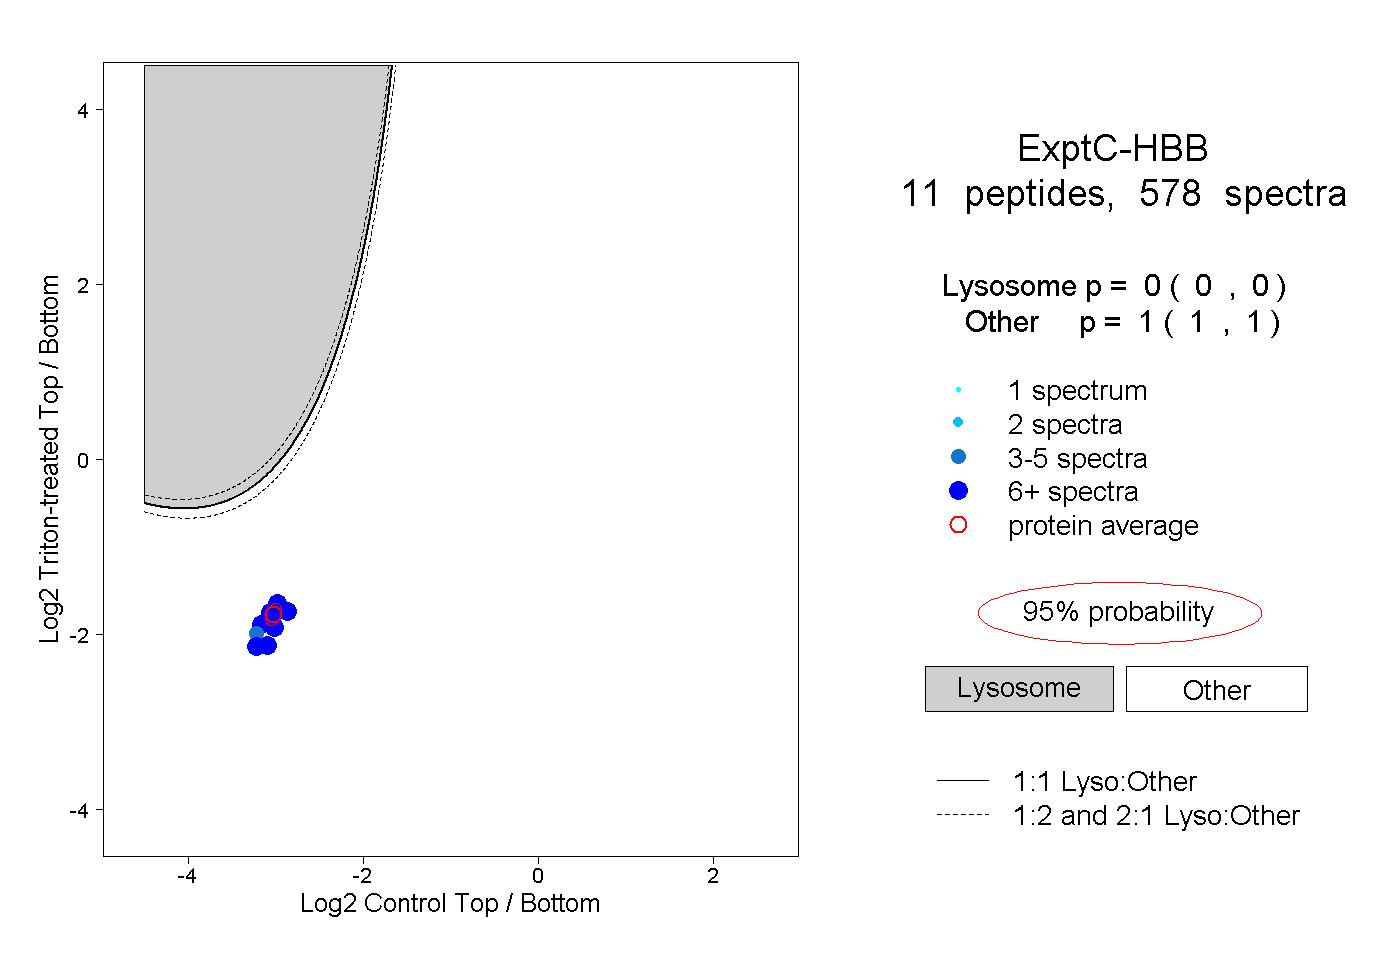
0.000 | 0.000
1.000 | 1.000
8peptides
spectra
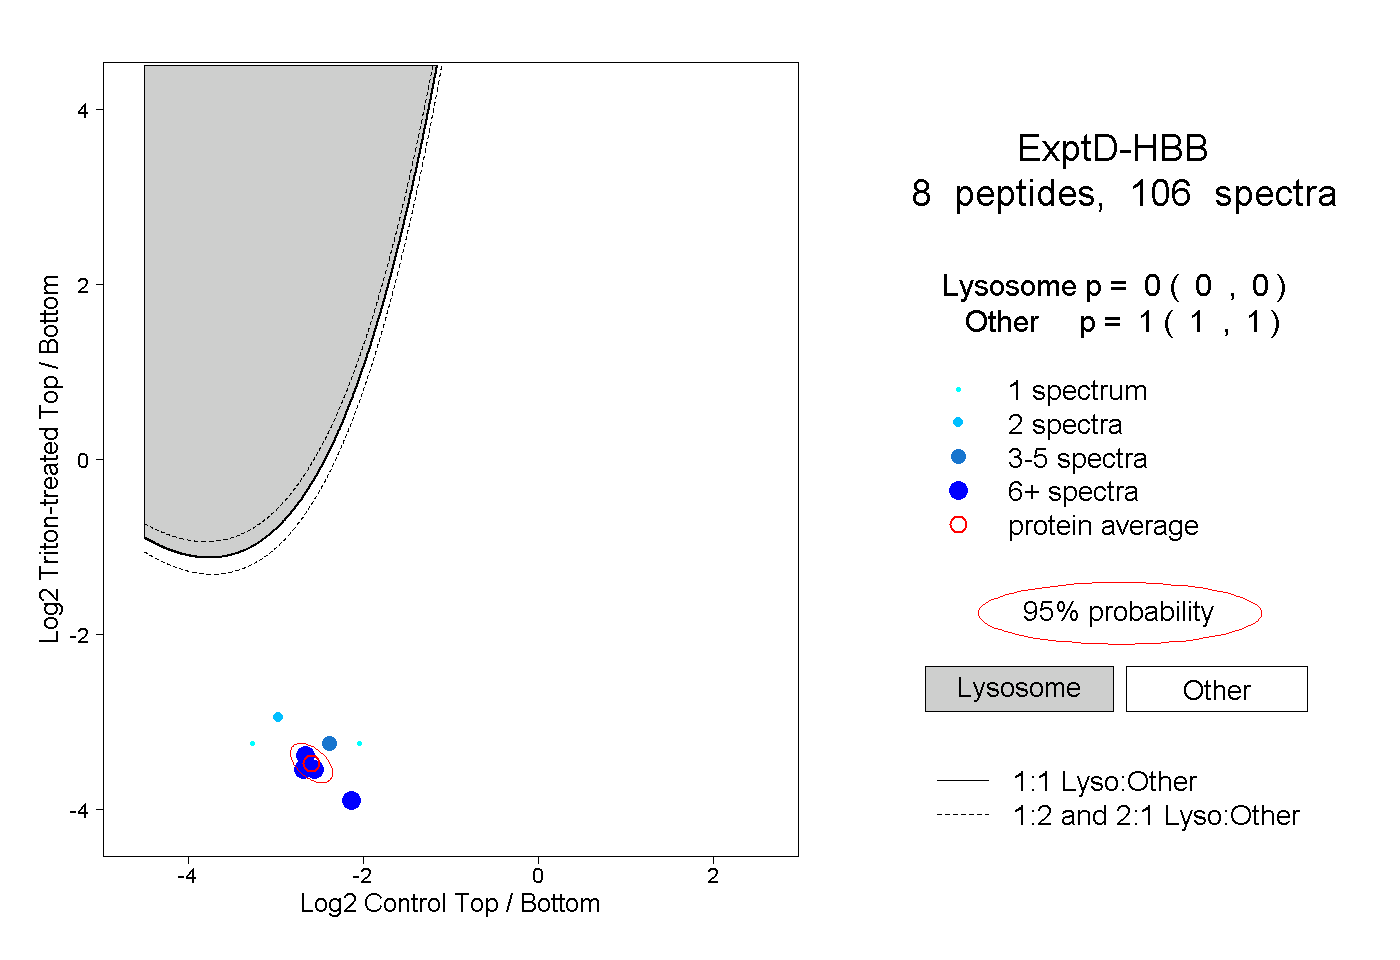
0.000 | 0.000
1.000 | 1.000