 2
2peptides
spectra
0.000 | 0.040
0.000 | 0.000
0.039 | 0.117
0.000 | 0.117
0.000 | 0.025
0.000 | 0.103
0.755 | 0.830
0.000 | 0.036
1peptide
spectra

0.000 | 0.000
1.000 | 1.000
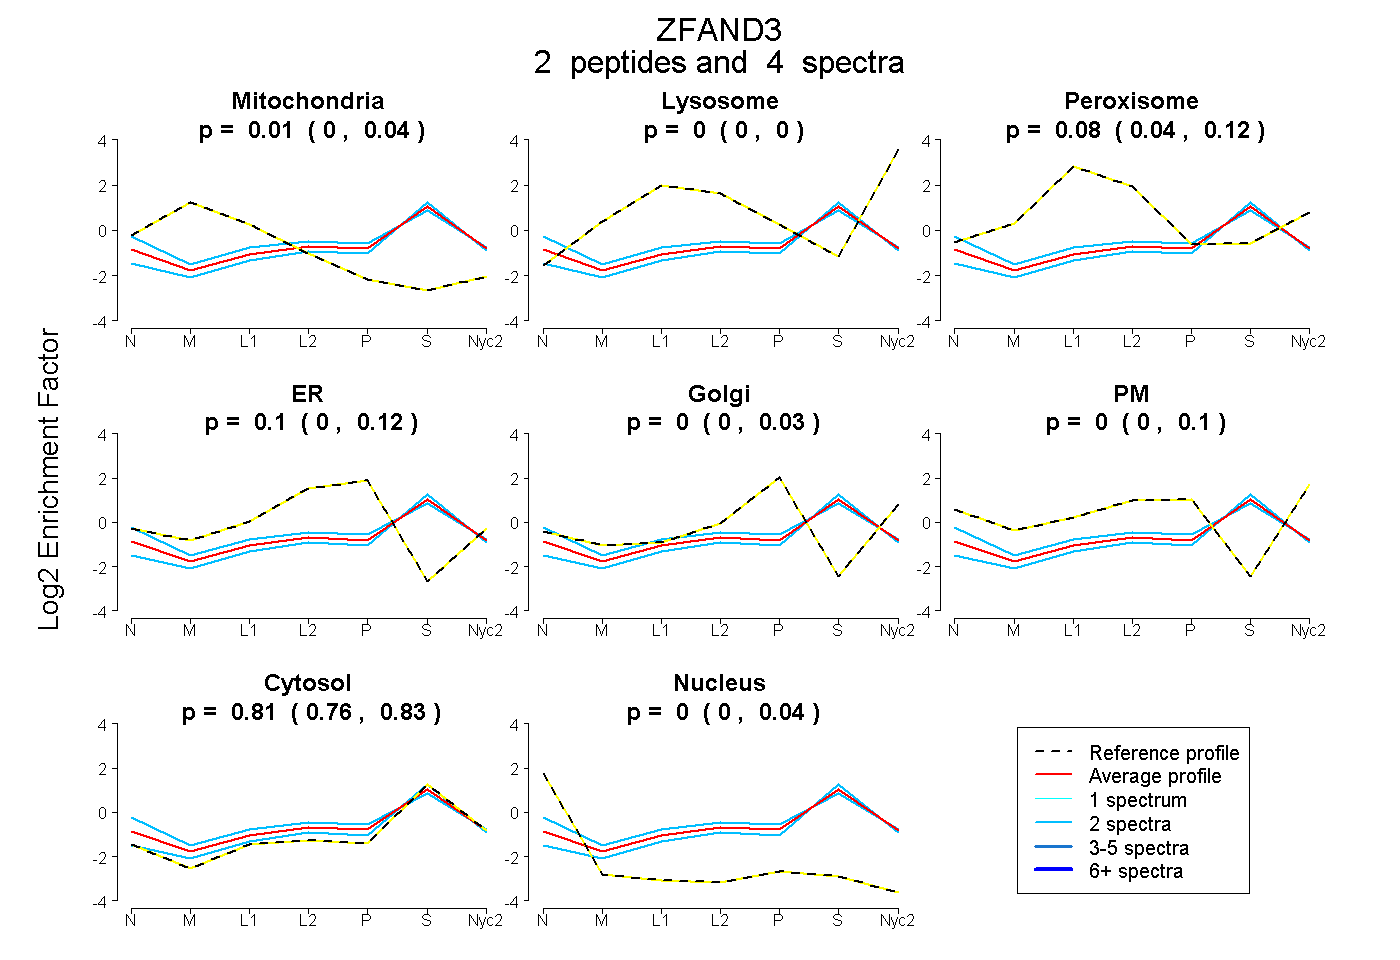
| Plot | Mito | Lyso | Perox | ER | Golgi | PM | Cytosol | Nucleus | |||||
| Expt A |
2 peptides |
4 spectra |
|
0.010 0.000 | 0.040 |
0.000 0.000 | 0.000 |
0.083 0.039 | 0.117 |
0.099 0.000 | 0.117 |
0.000 0.000 | 0.025 |
0.000 0.000 | 0.103 |
0.809 0.755 | 0.830 |
0.000 0.000 | 0.036 |
||
| Plot | Lyso | Other | |||||||||||
| Expt C |
1 peptide |
4 spectra |
|
0.000 0.000 | 0.000 |
1.000 1.000 | 1.000 |